PBS Insights
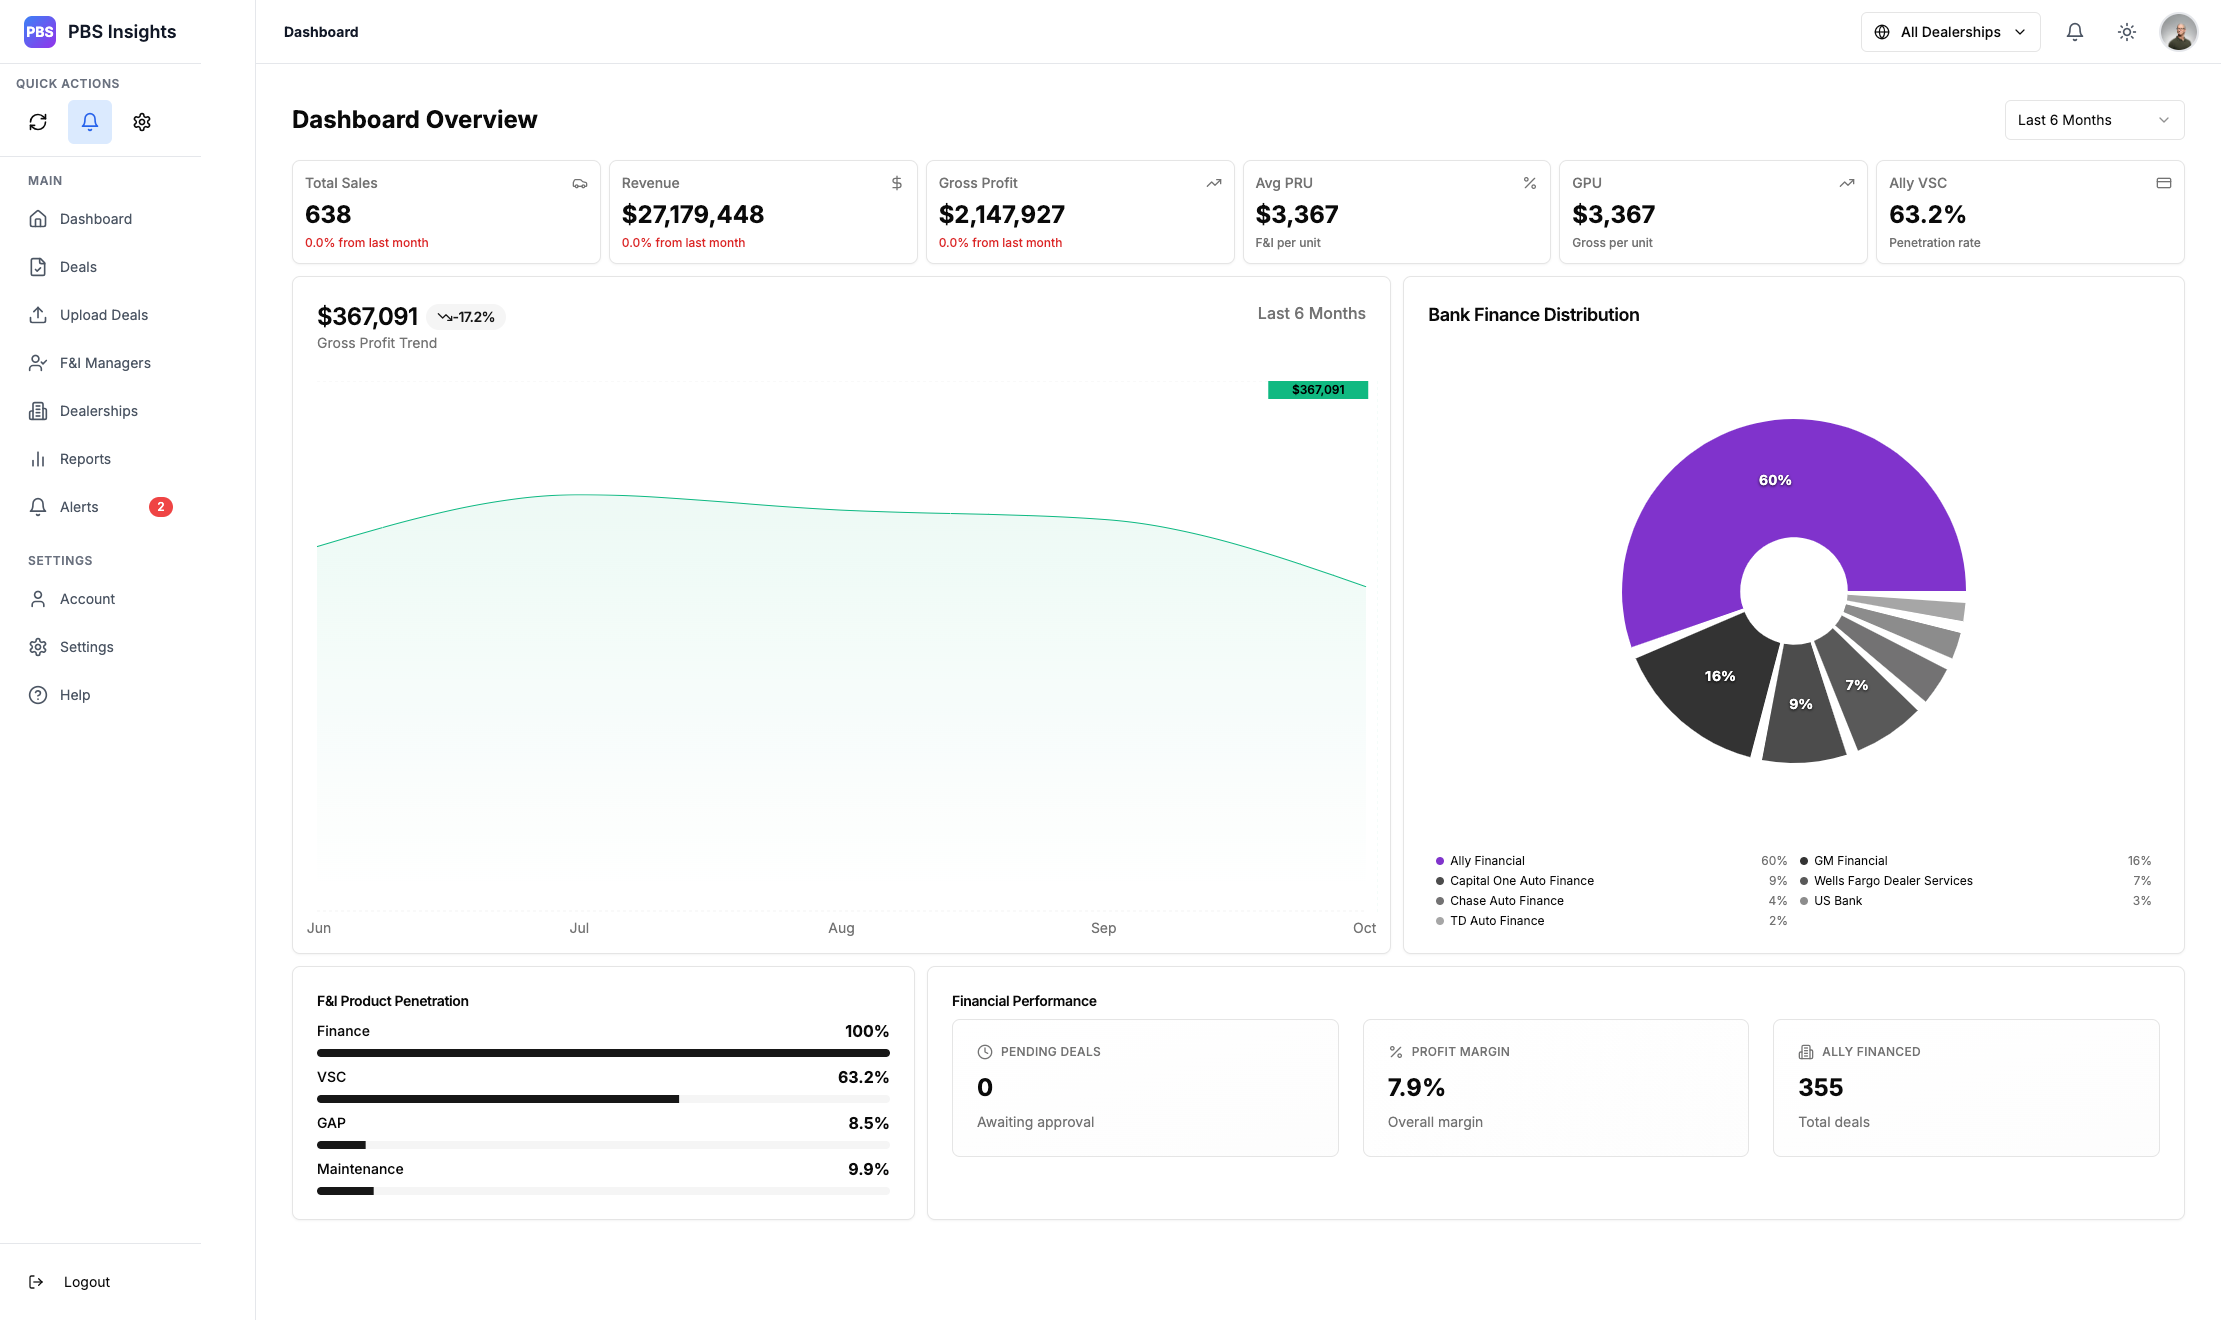
Dashboard
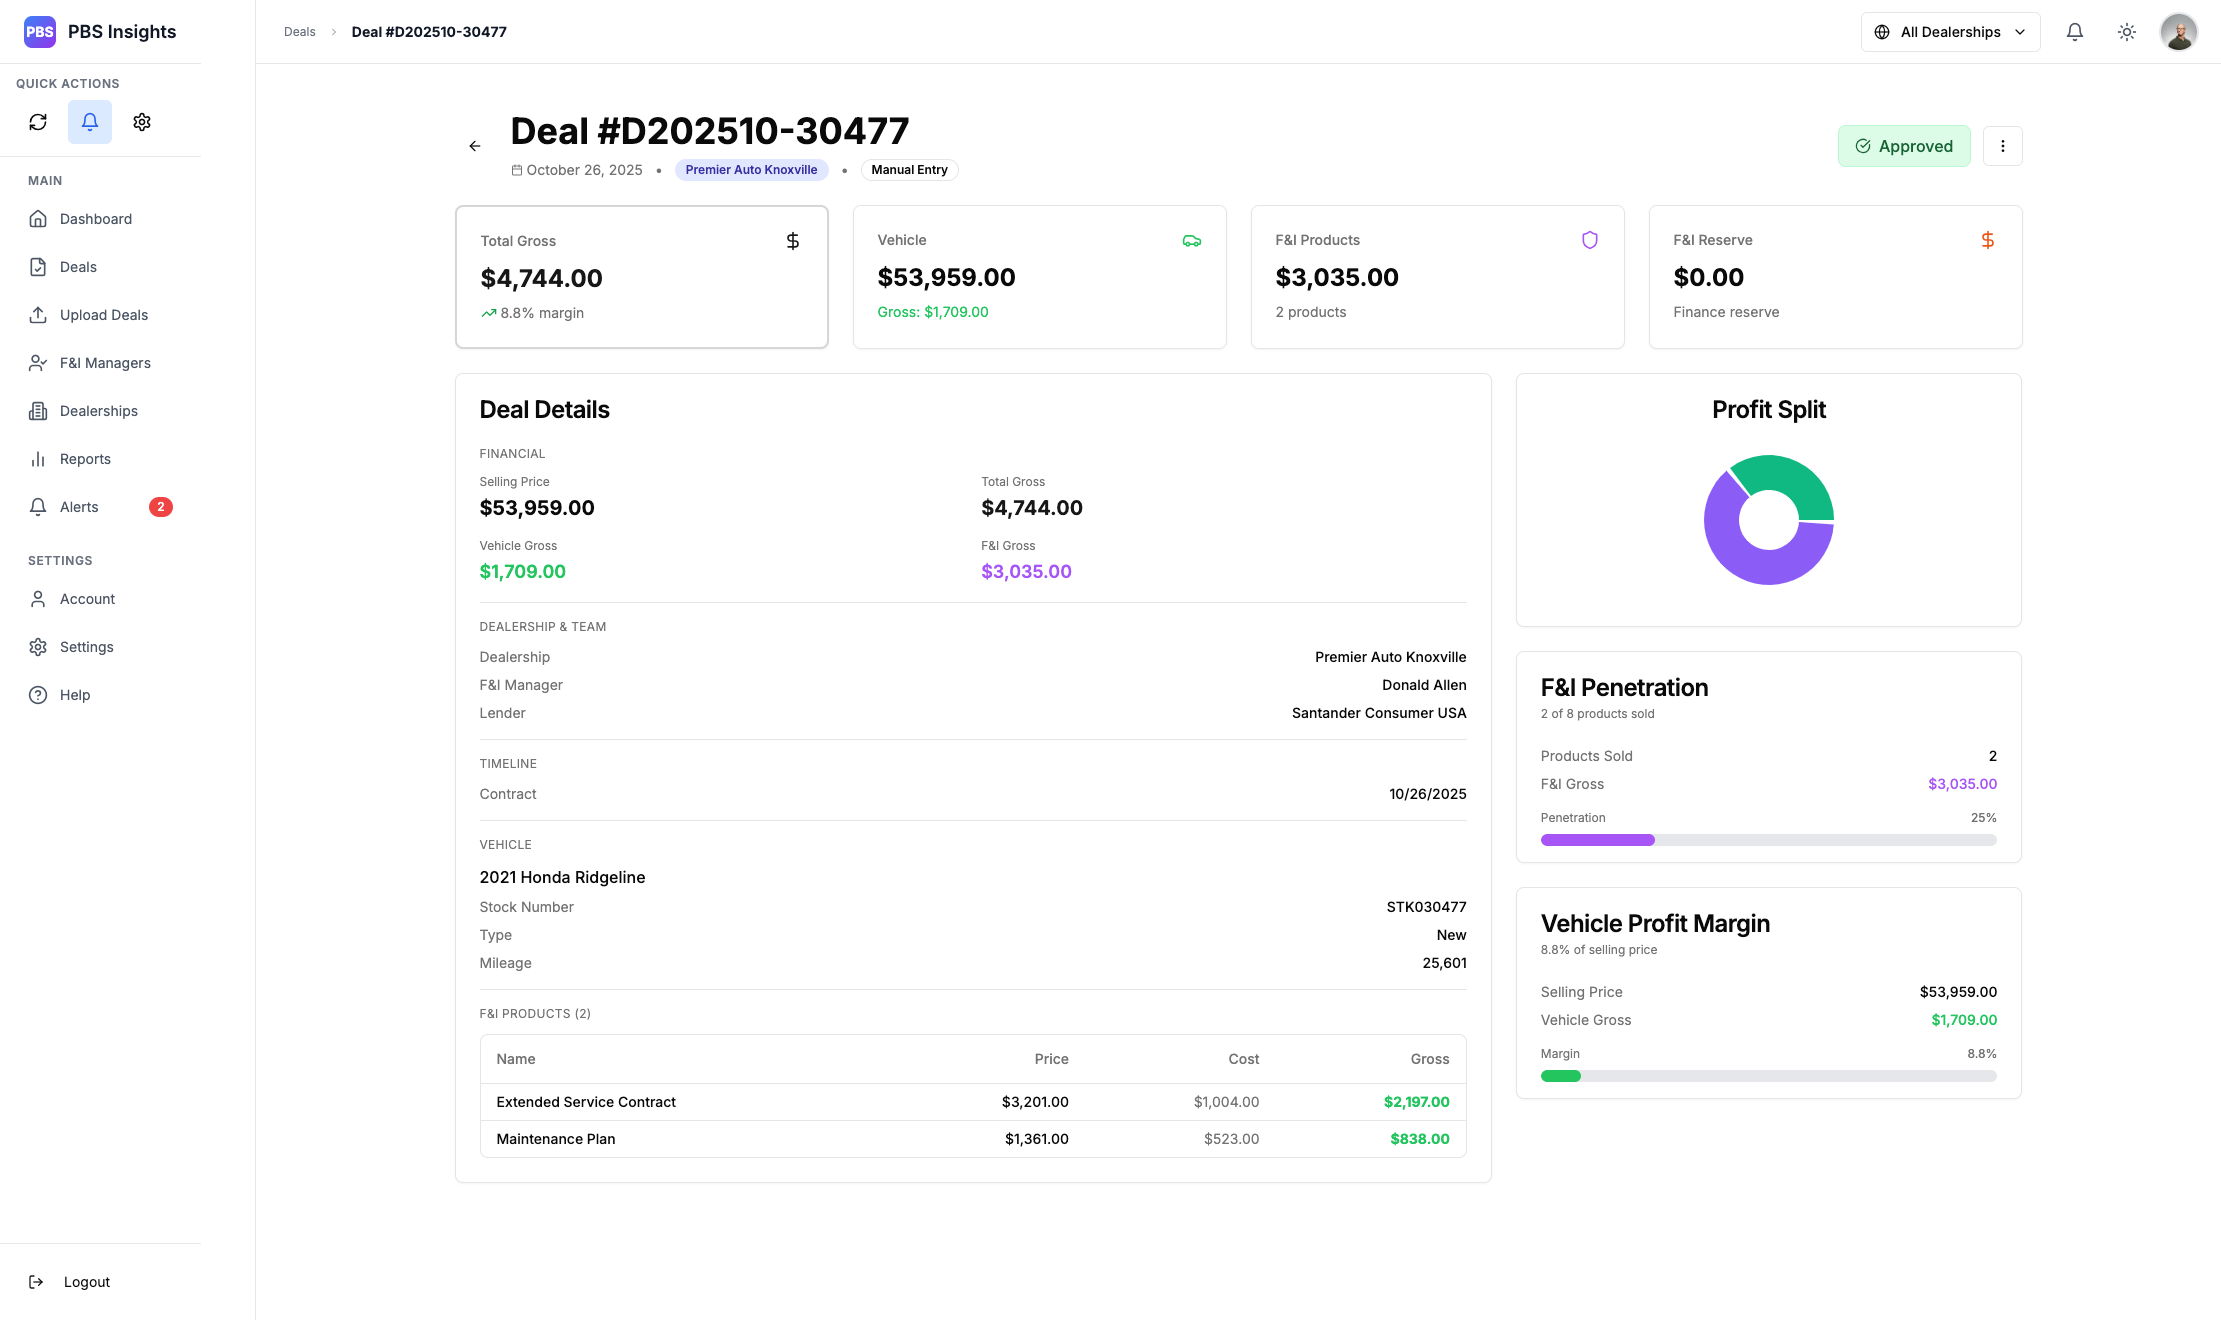
Deal Page
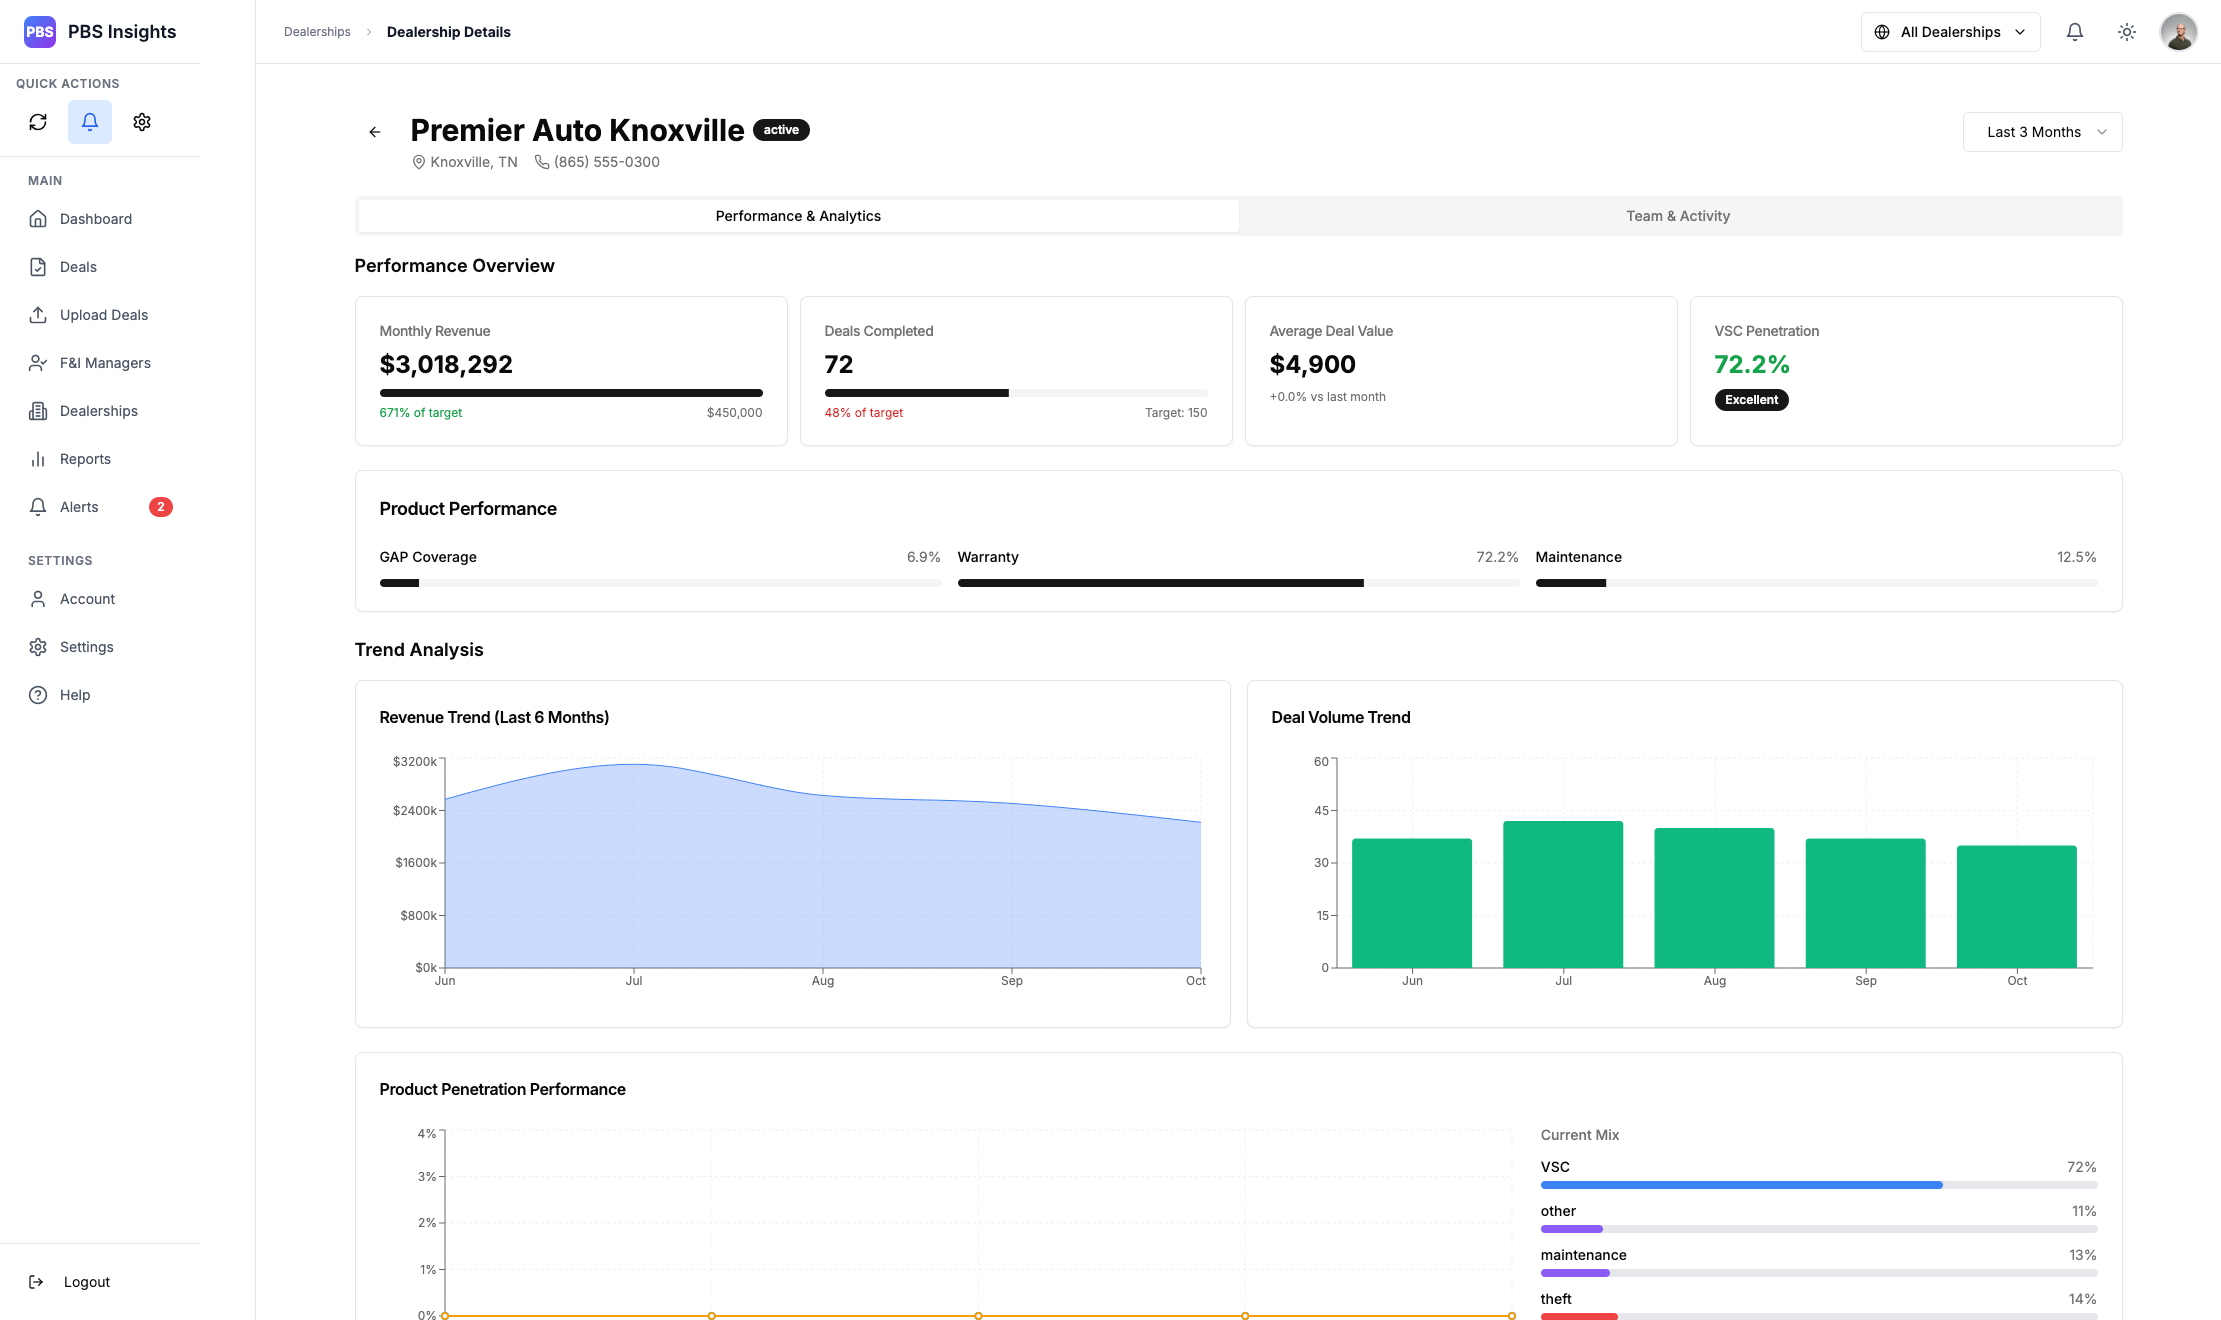
Dealership Management Page
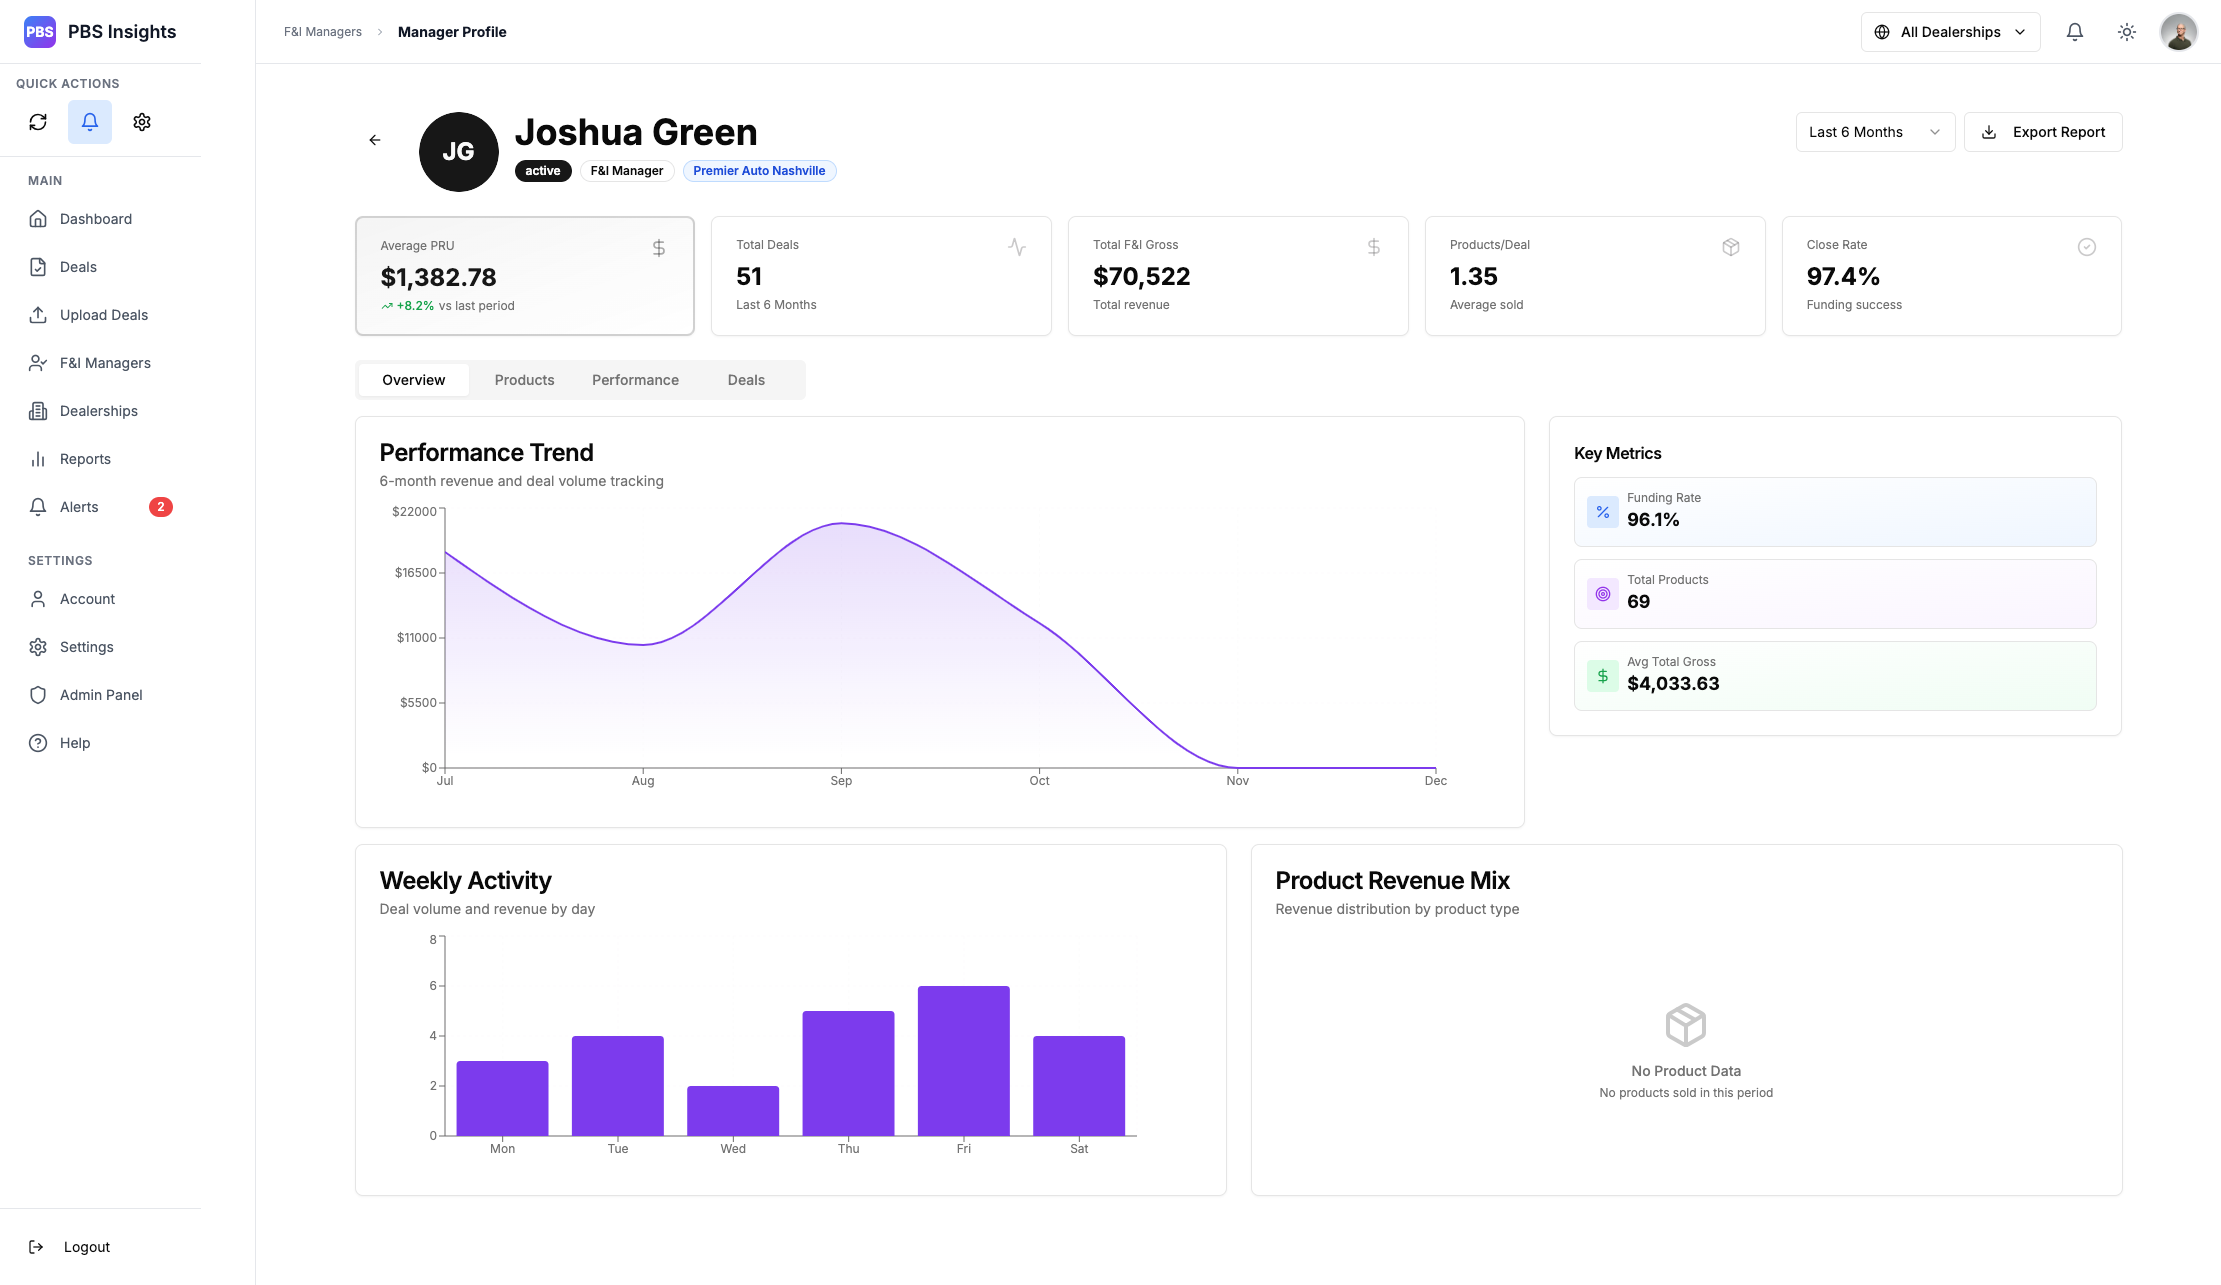
F&I Manager Profiles
Stats for Nerds:
- Team Size: 1
- Timeline: 6 months (ongoing)
- Language: JavaScript / TypeScript
- Framework(s):
- React + NextJS
- NodeJS + Express
- Tailwind + Recharts
- PostgreSQL
- Redis + Bull
- Tools:
- Claude
- Cursor
- Docker
- Vercel
- Railway
- Deployment: https://pbs-insights.vercel.app/login
- Repository:
Privated
The Concept
PBS Insights is the lovechild of a need for clear analytical data and a meticulously crafted Google Spreadsheet that attempted to do just that. While a spreadsheet with a bunch of functions and math is “functional”, it’s not pretty, and it’s definitely not user-friendly.
My work began with the question: “How do I present analytical data clearly and efficiently”. The initial design was sketched up in MS Paint, as I do with all my designs, and built on the budding framework of StockSync; you’ll see similar design language between the two, as I re-used a lot of the same initial codebase to help kickstart this project.
With StockSync, I was working on an invoice/purchase order system that leveraged AI to process pages of data into actionable analytics. You can read more on that here: [link to StockSync]. This translated perfectly to what I was trying to achieve with PBS Insights, and became the backbone for the applications creation.
This application is built for Director roles and up on the surface, with actionable detail screens built for F&I managers using a friendly competition style of leaderboard and individual profiles.
The User Story
Directors
Imagine yourself as a director at a large scale dealership. You have about 12 direct reports, and you meet with them weekly to review their performance. Fictional F&I Manager “Joshua Green” comes into your office and sits across from you.
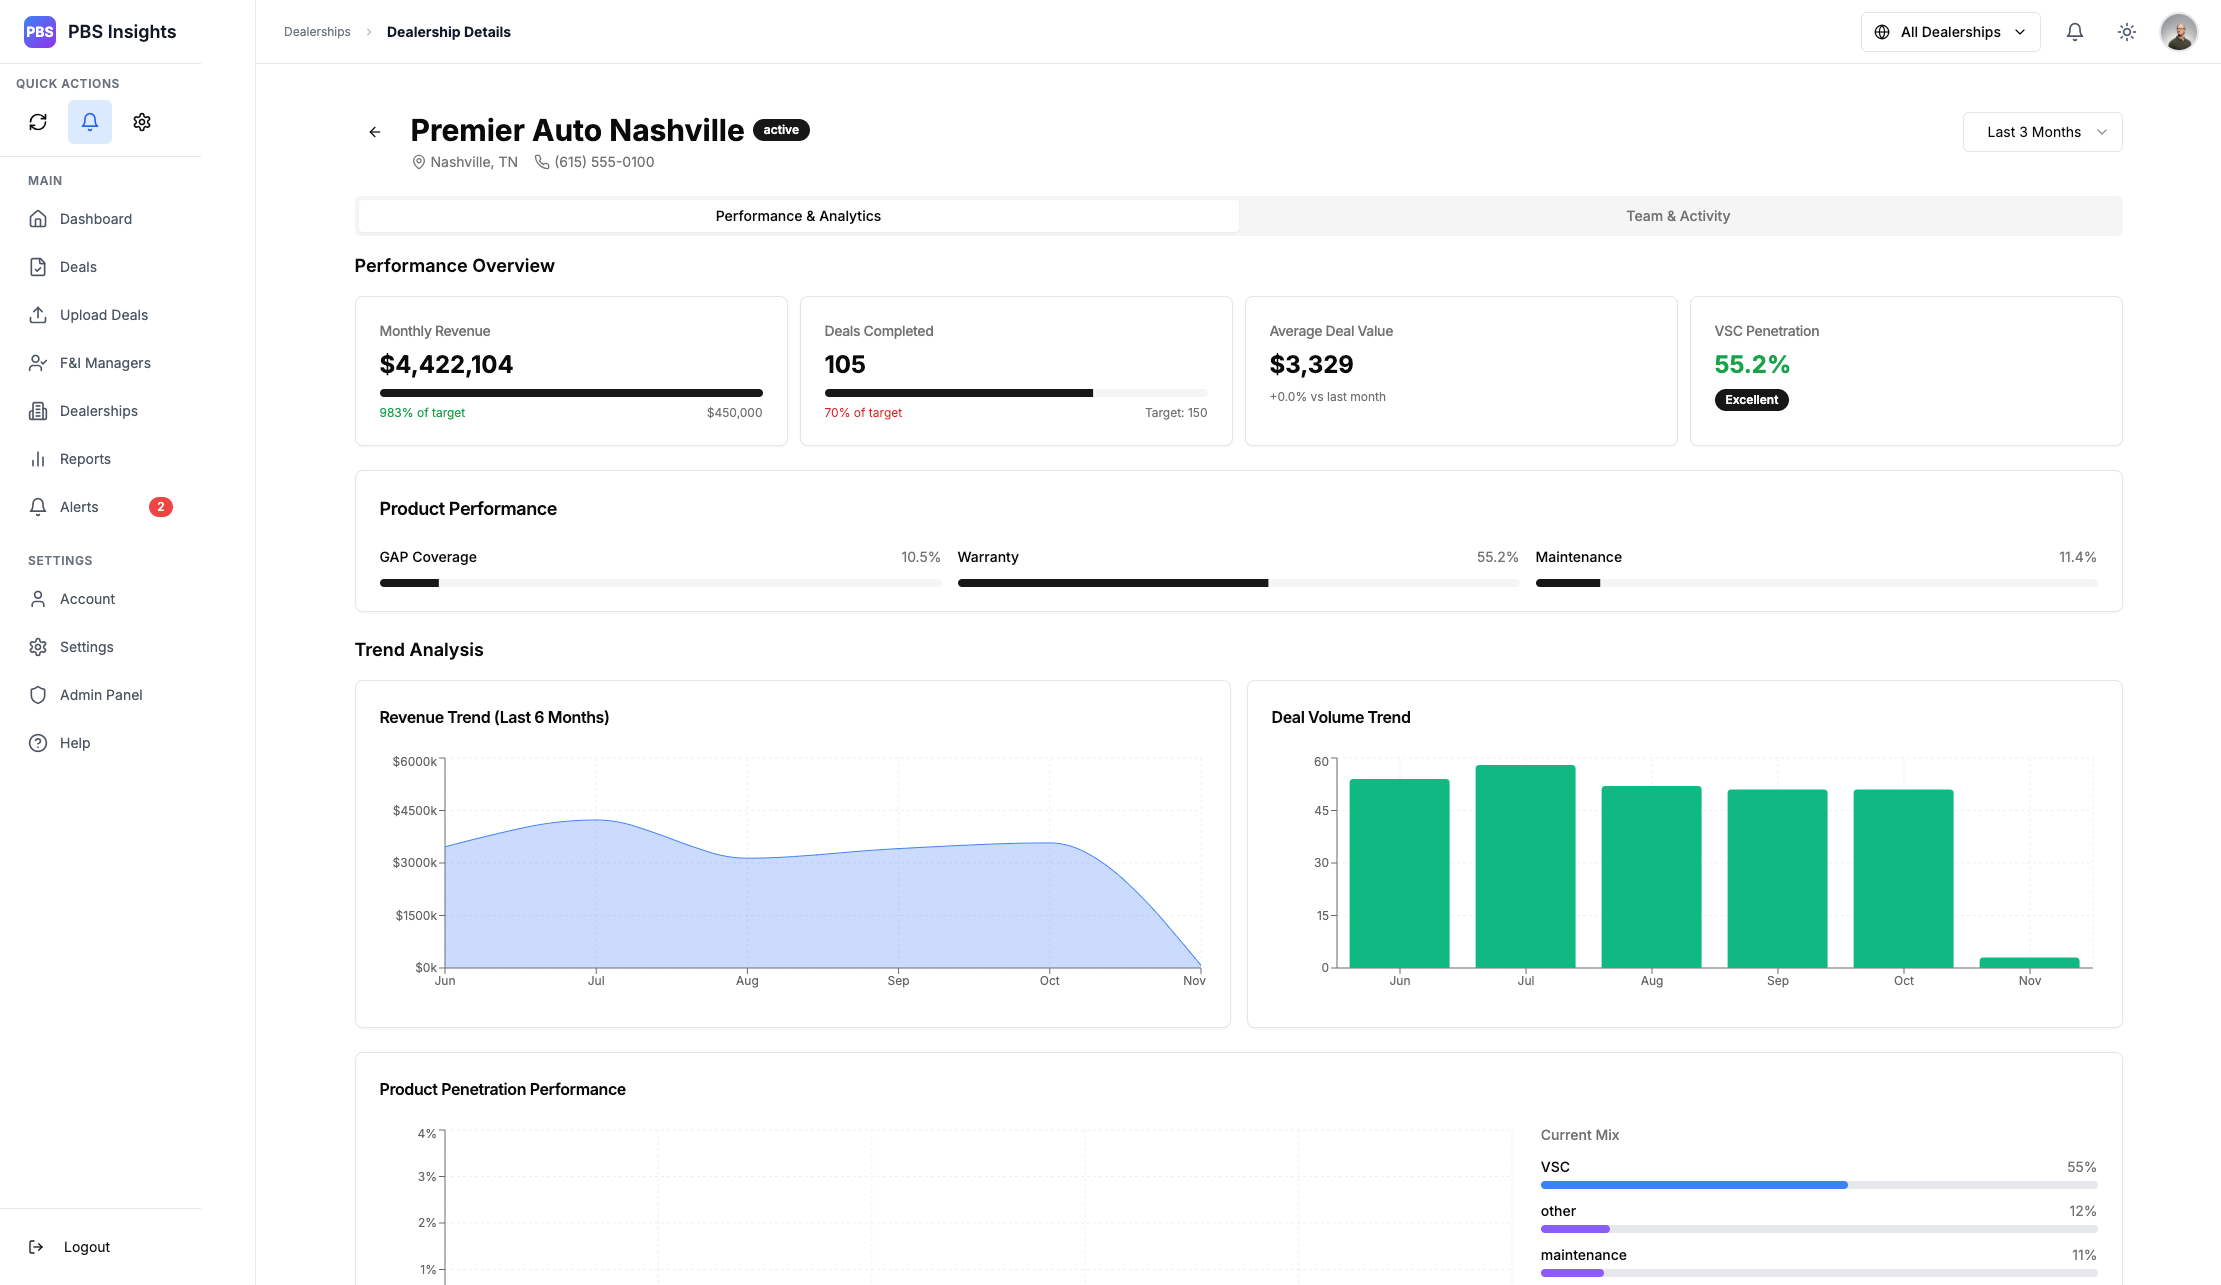
Going into this, you have full confidence in his performance, his metrics, and what he’s been up to. You didn’t need to prepare for this meeting before hand, because you have his profile pulled up already. Everything you need is already there: his performance trends, his funding rate, the total deal gross he’s done over the past month, even a granular breakdown of his product penetration rates.
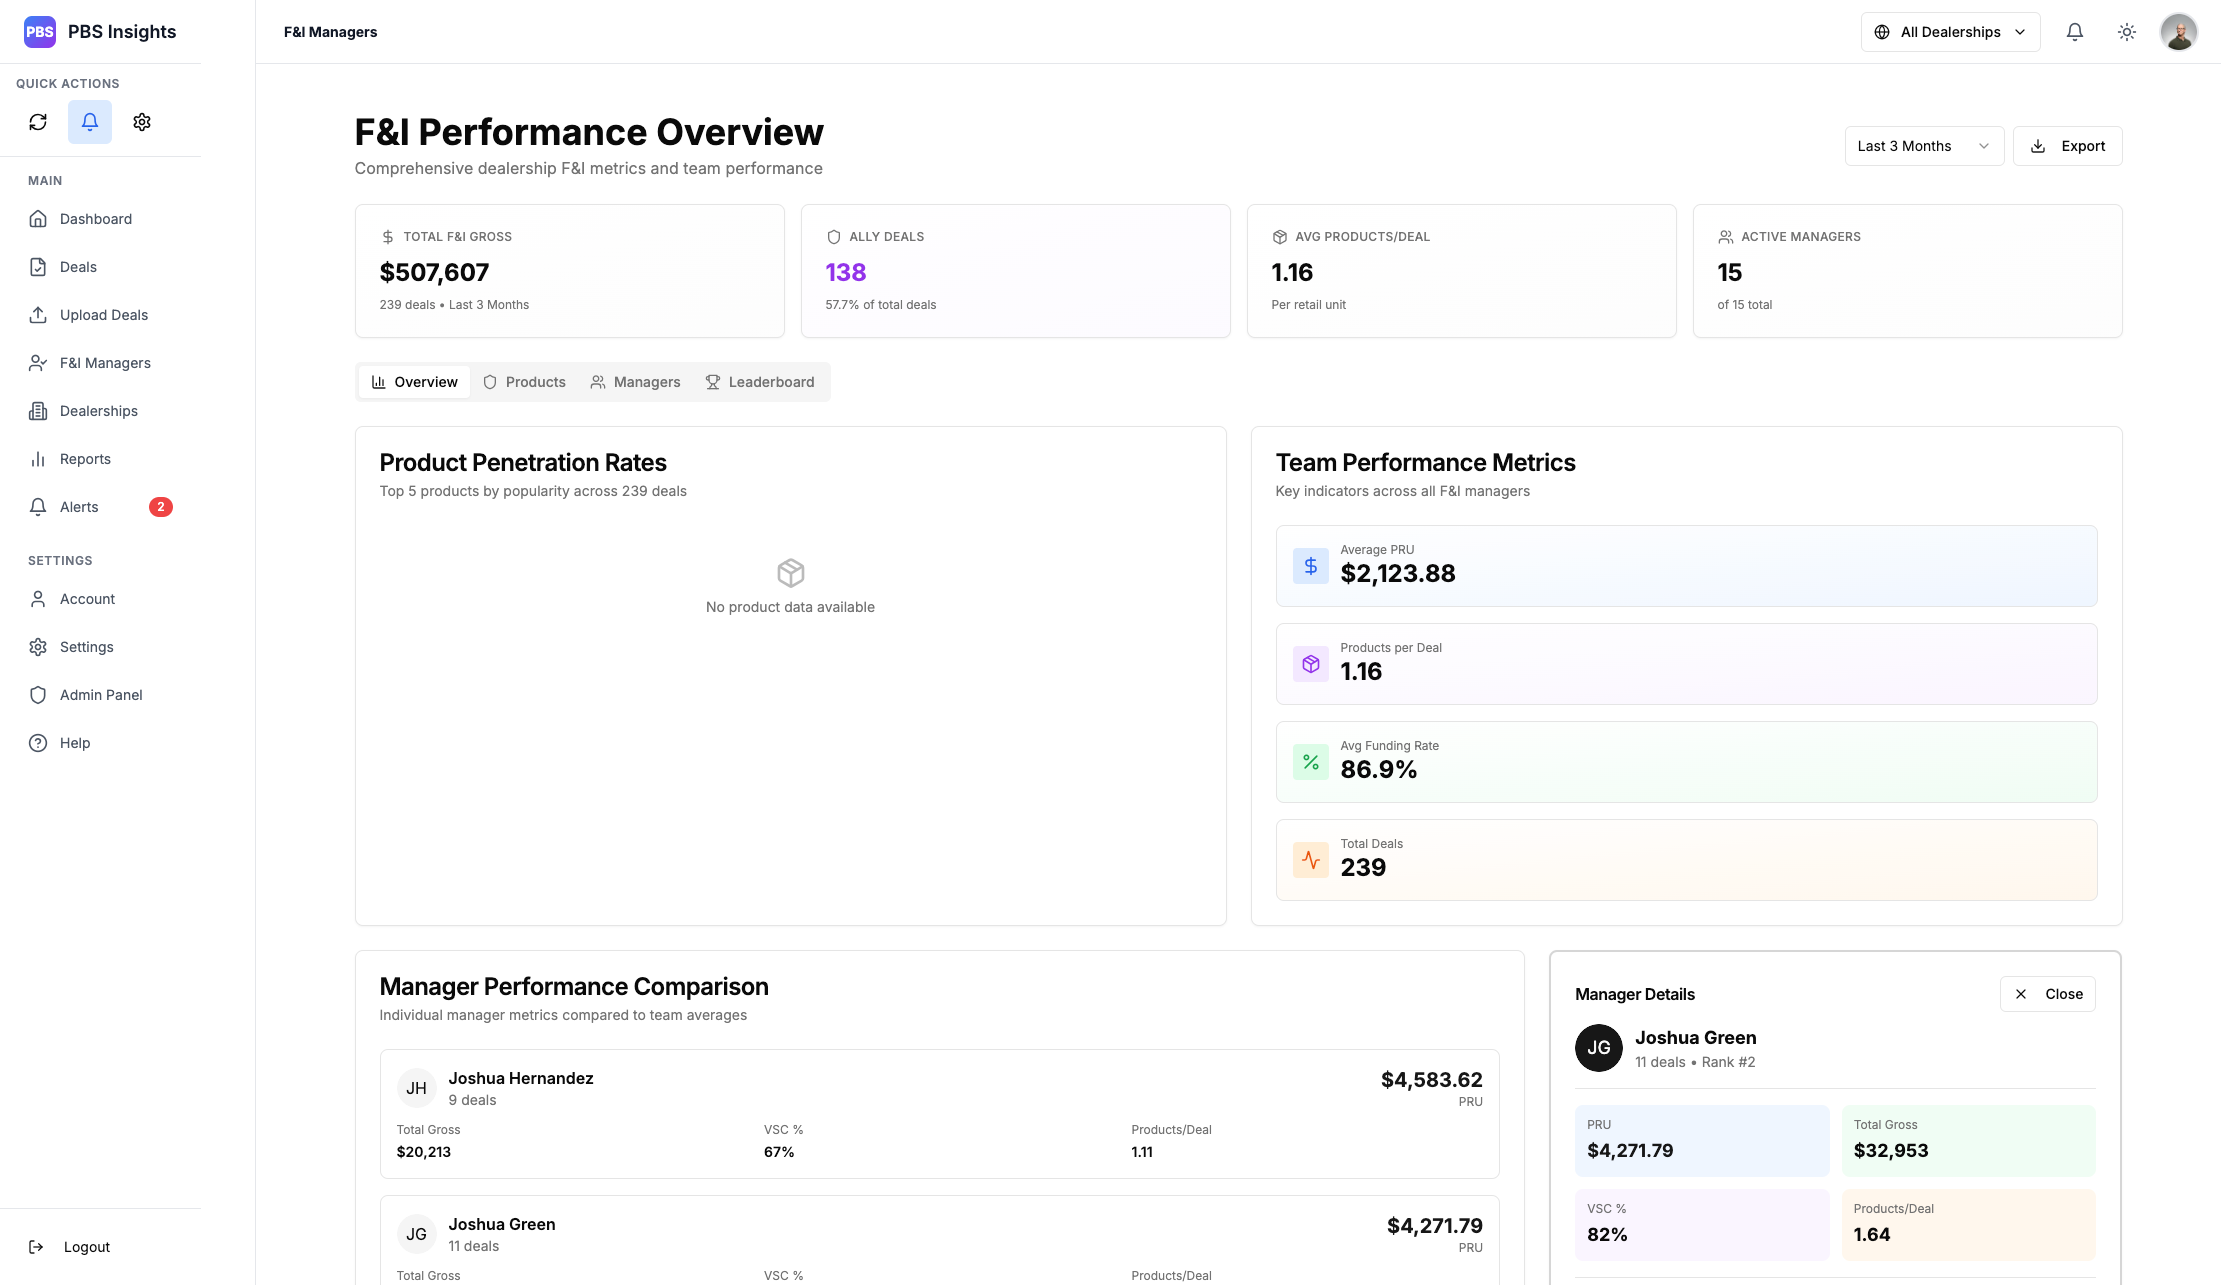
F&I Performance Overview
F&I Manager Profile
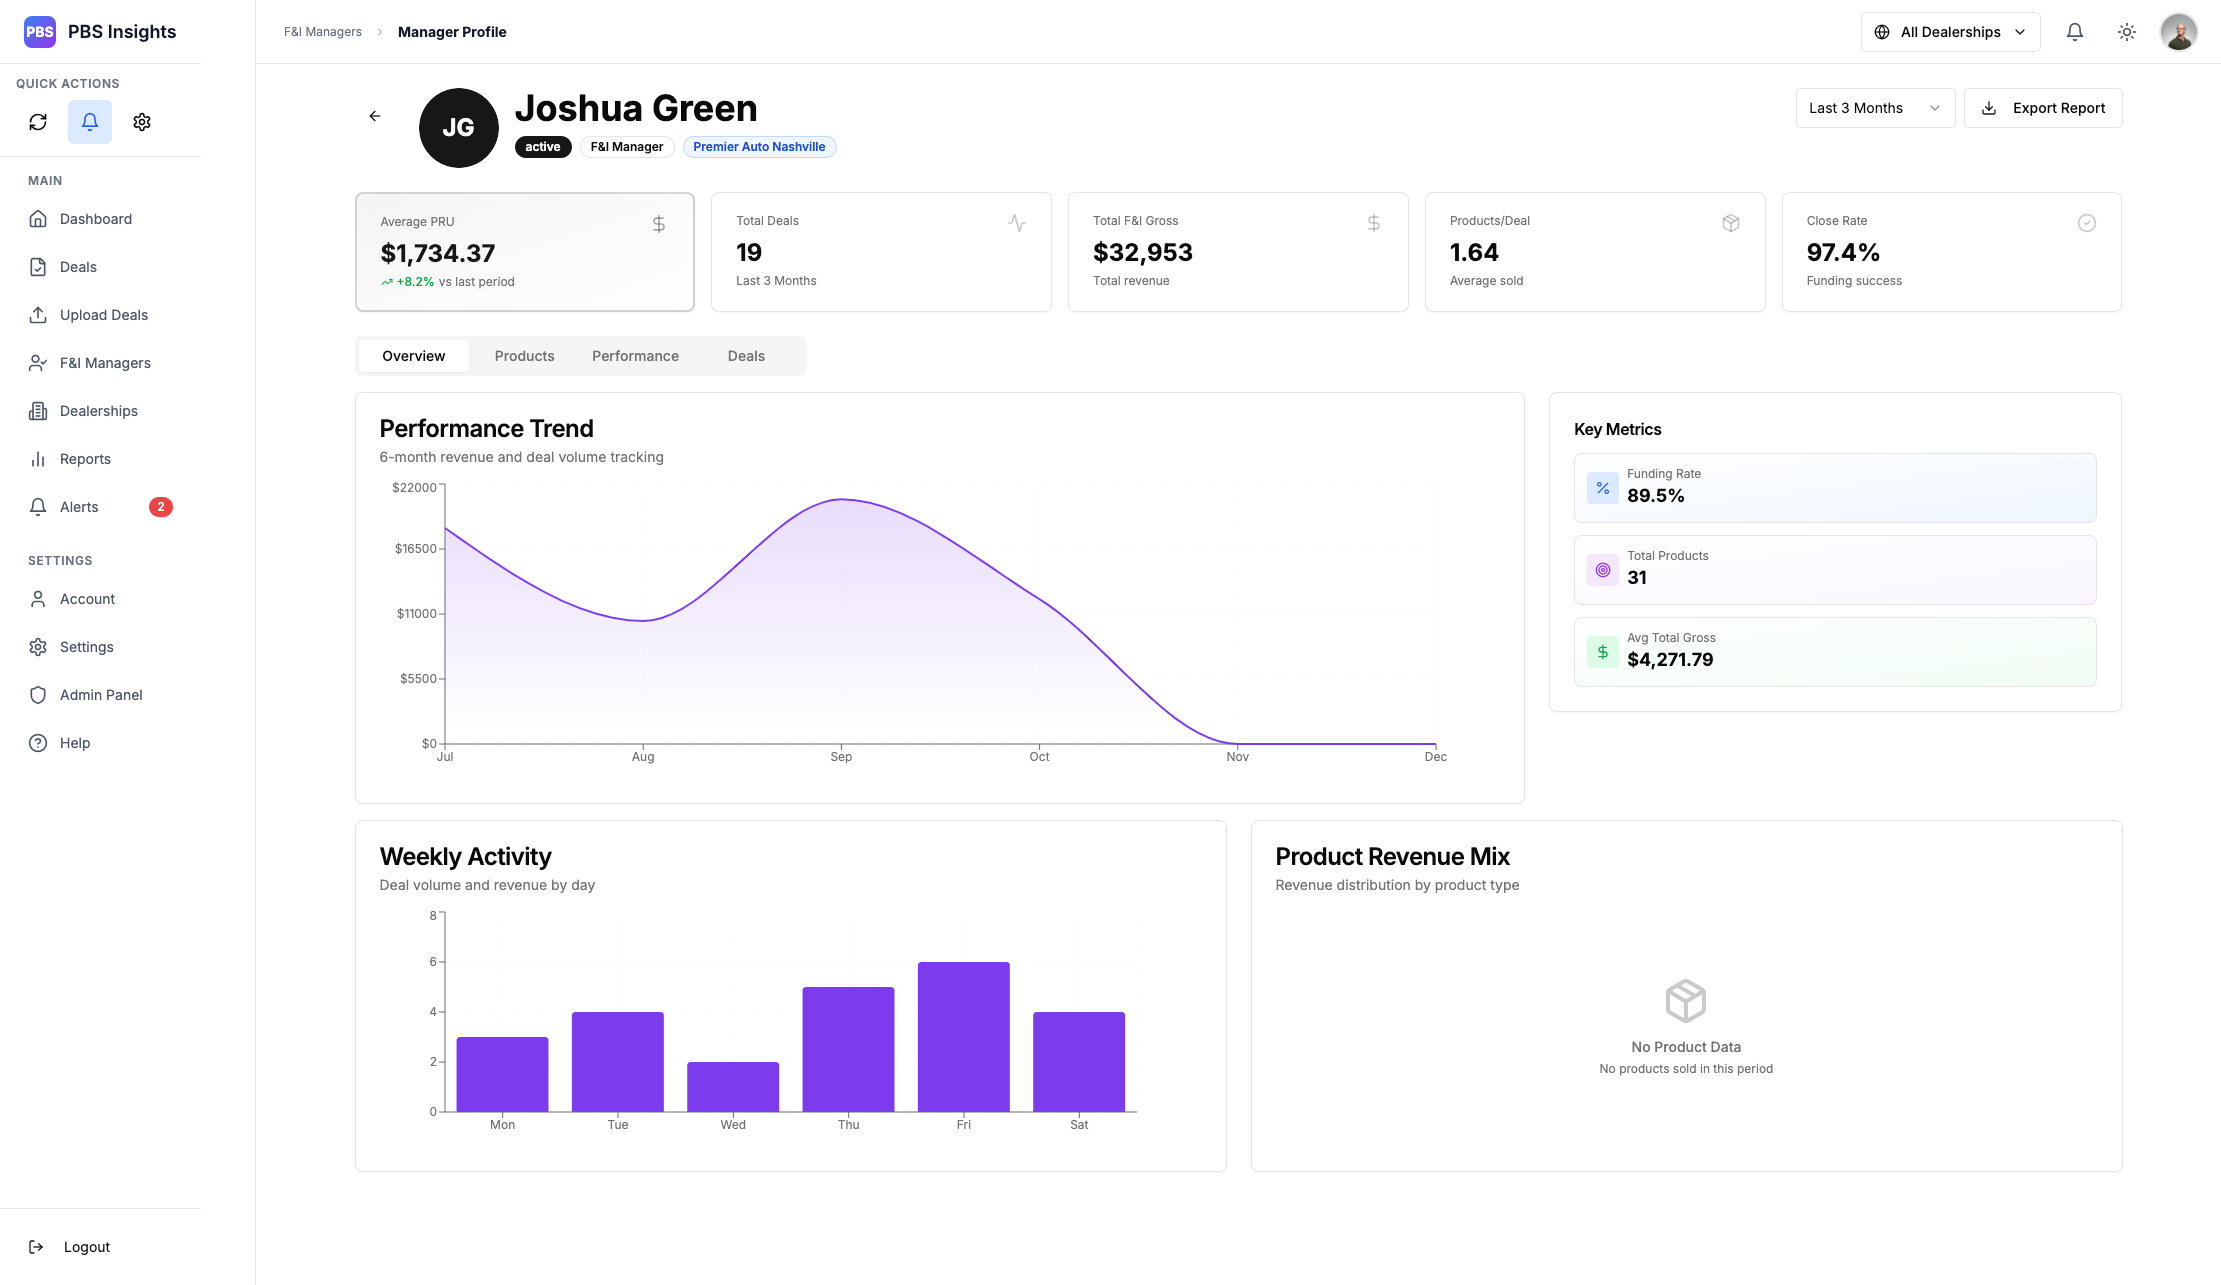
Turning your monitor to show him, you pull up one of his most recent deals that he closed, clearly displayed in the “Recent Deals” page of his profile. You both review the deal analytics together, seeing the structure and breakdown of the deal, and you talk about some things he could potentially improve on.
You have actionable data you can show, graphs, breakdowns of everything that he has achieved and you’re ready to reward that hard work. Josh is stoked, and you hand him a $600 bonus in cash for securing the goals you had set for him. He leaves your office with a grin spread across his face, and all you had to do was open his profile.
No sheets of paper, no condensing his metrics. You knew how he was doing at a glance, and so did he. There was no guesswork, and you’ve now got those tens of hours of free time to focus on things that are more important to your role.
F&I Managers
You’re are fictional F&I manager “Amy Lee”. You’ve been doing this for a few years, and having worked your way up from sales into this lucrative role, you take what you do very seriously. You keep a binder of your previous deals, you review your interactions in a mental replay after each customer, and you look at every deal as an opportunity to secure the maximum amount of back-end gross.
After your deals have been secured, you pop into PBS Insights to upload your deal sheet. You’re in 2nd place on the leaderboard, and you already know that deal just secured you a competitive spot with Josh Green - the current #1.
F&I Performance Leaderboard
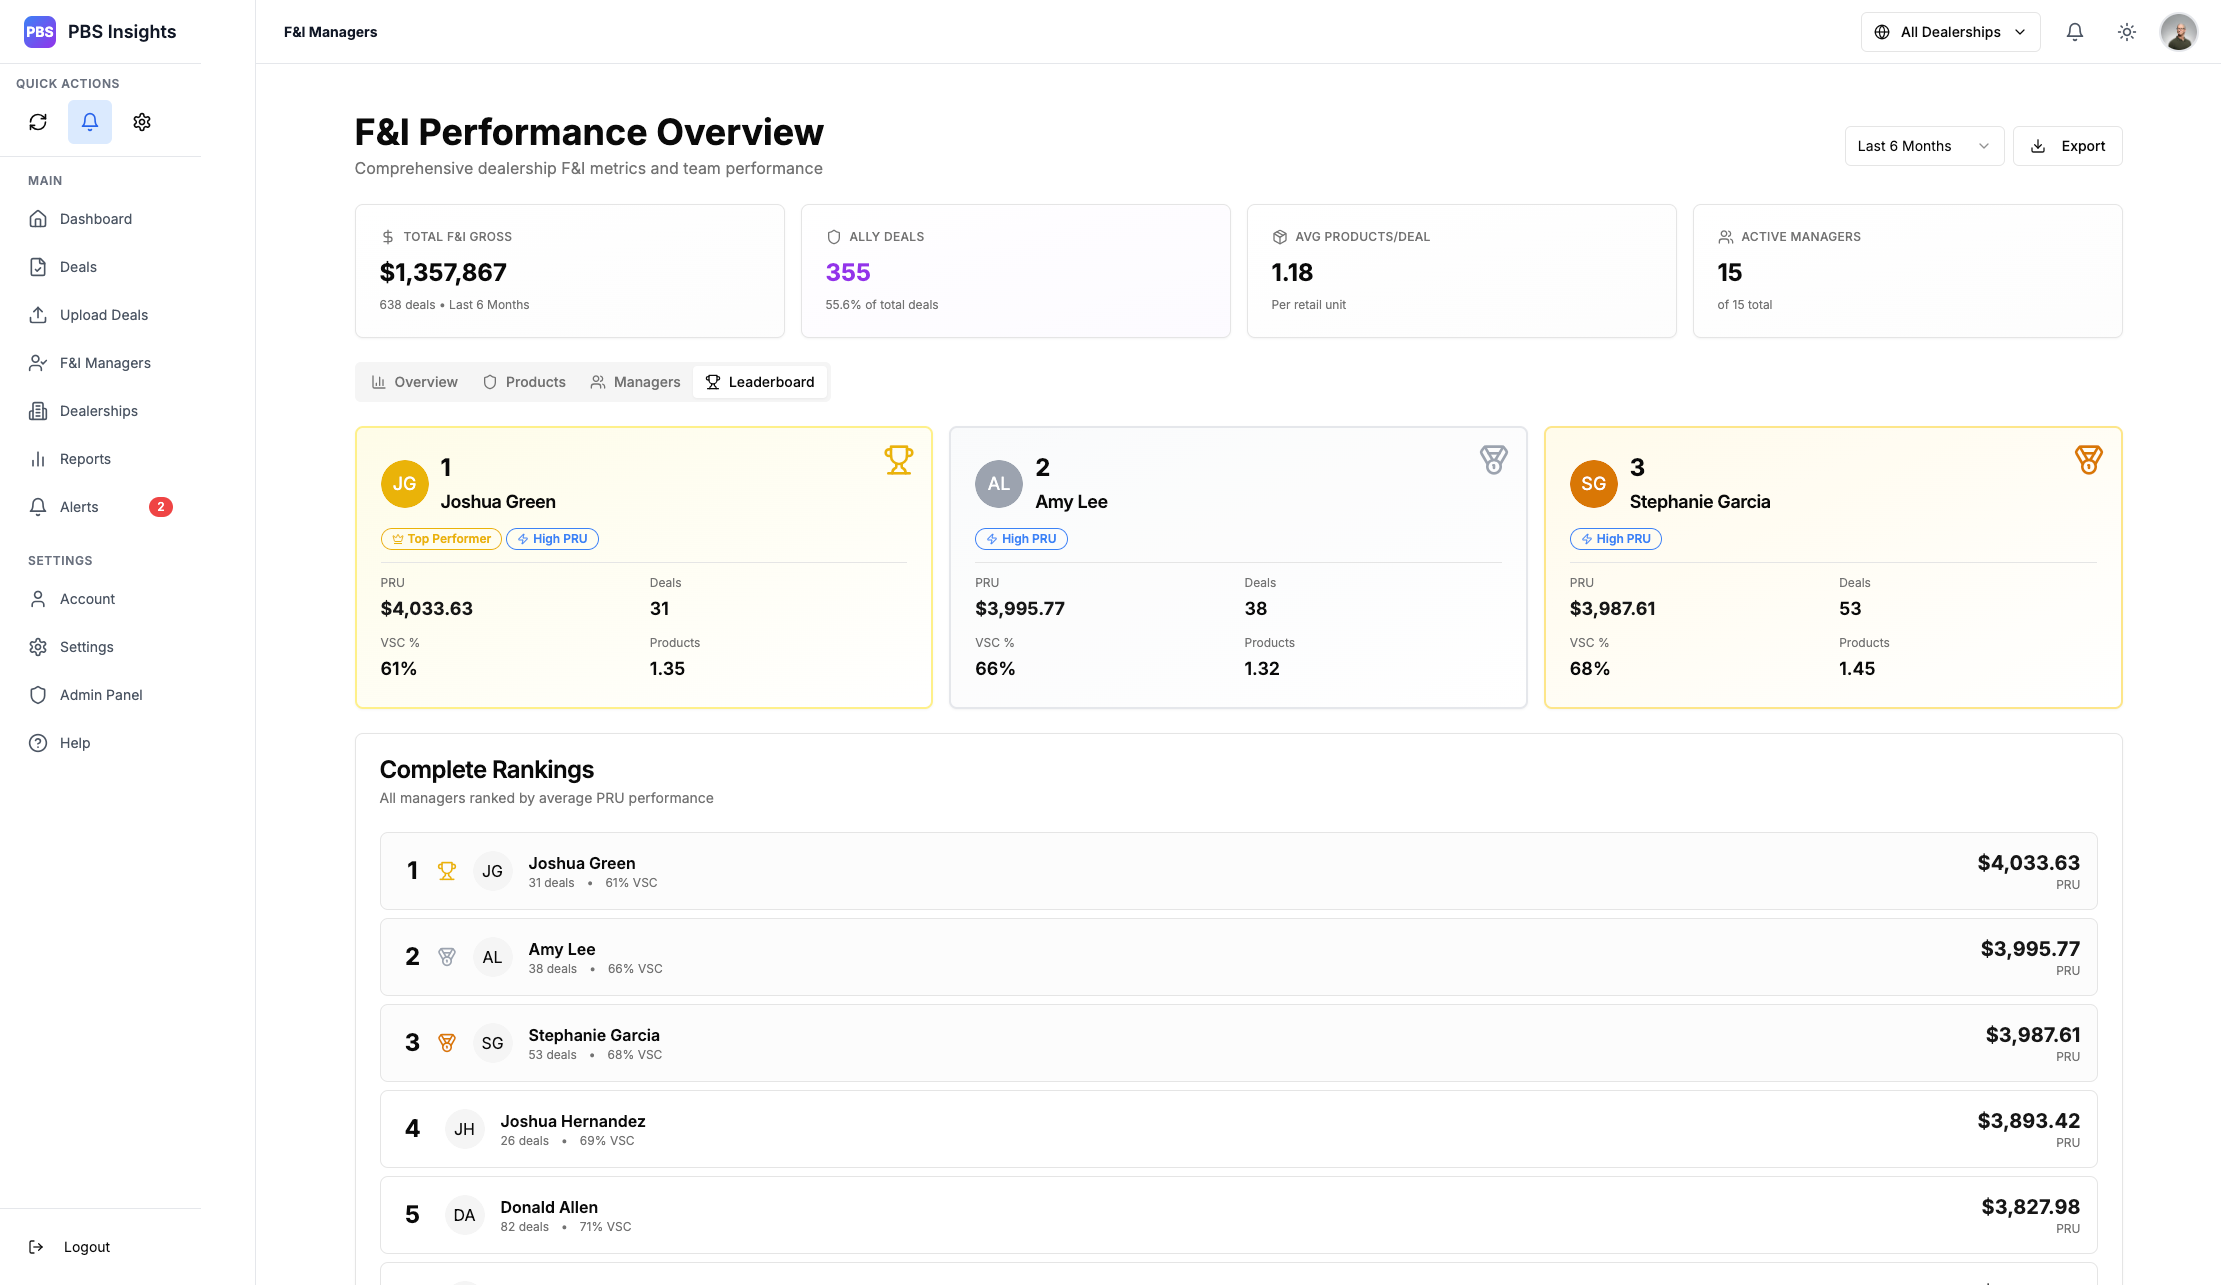
You upload your deal, and skim the deal overview. You secured a $4k holdback, and you landed full penetration of all the products. You even nailed the Ally Financial target, netting you a nice little purple marker next to the deal; something your manager will be very happy to see.
Replaying the interaction in your mind, you make personal notes of what to improve on for next time, as another customer walks into your office. You feel inspired, you’re going to secure a solid product line-up on this deal, and that #1 spot will be yours. You have actionable feedback on the deal you just finished, and you’re ready to use it going into your next customer interaction.
Executives
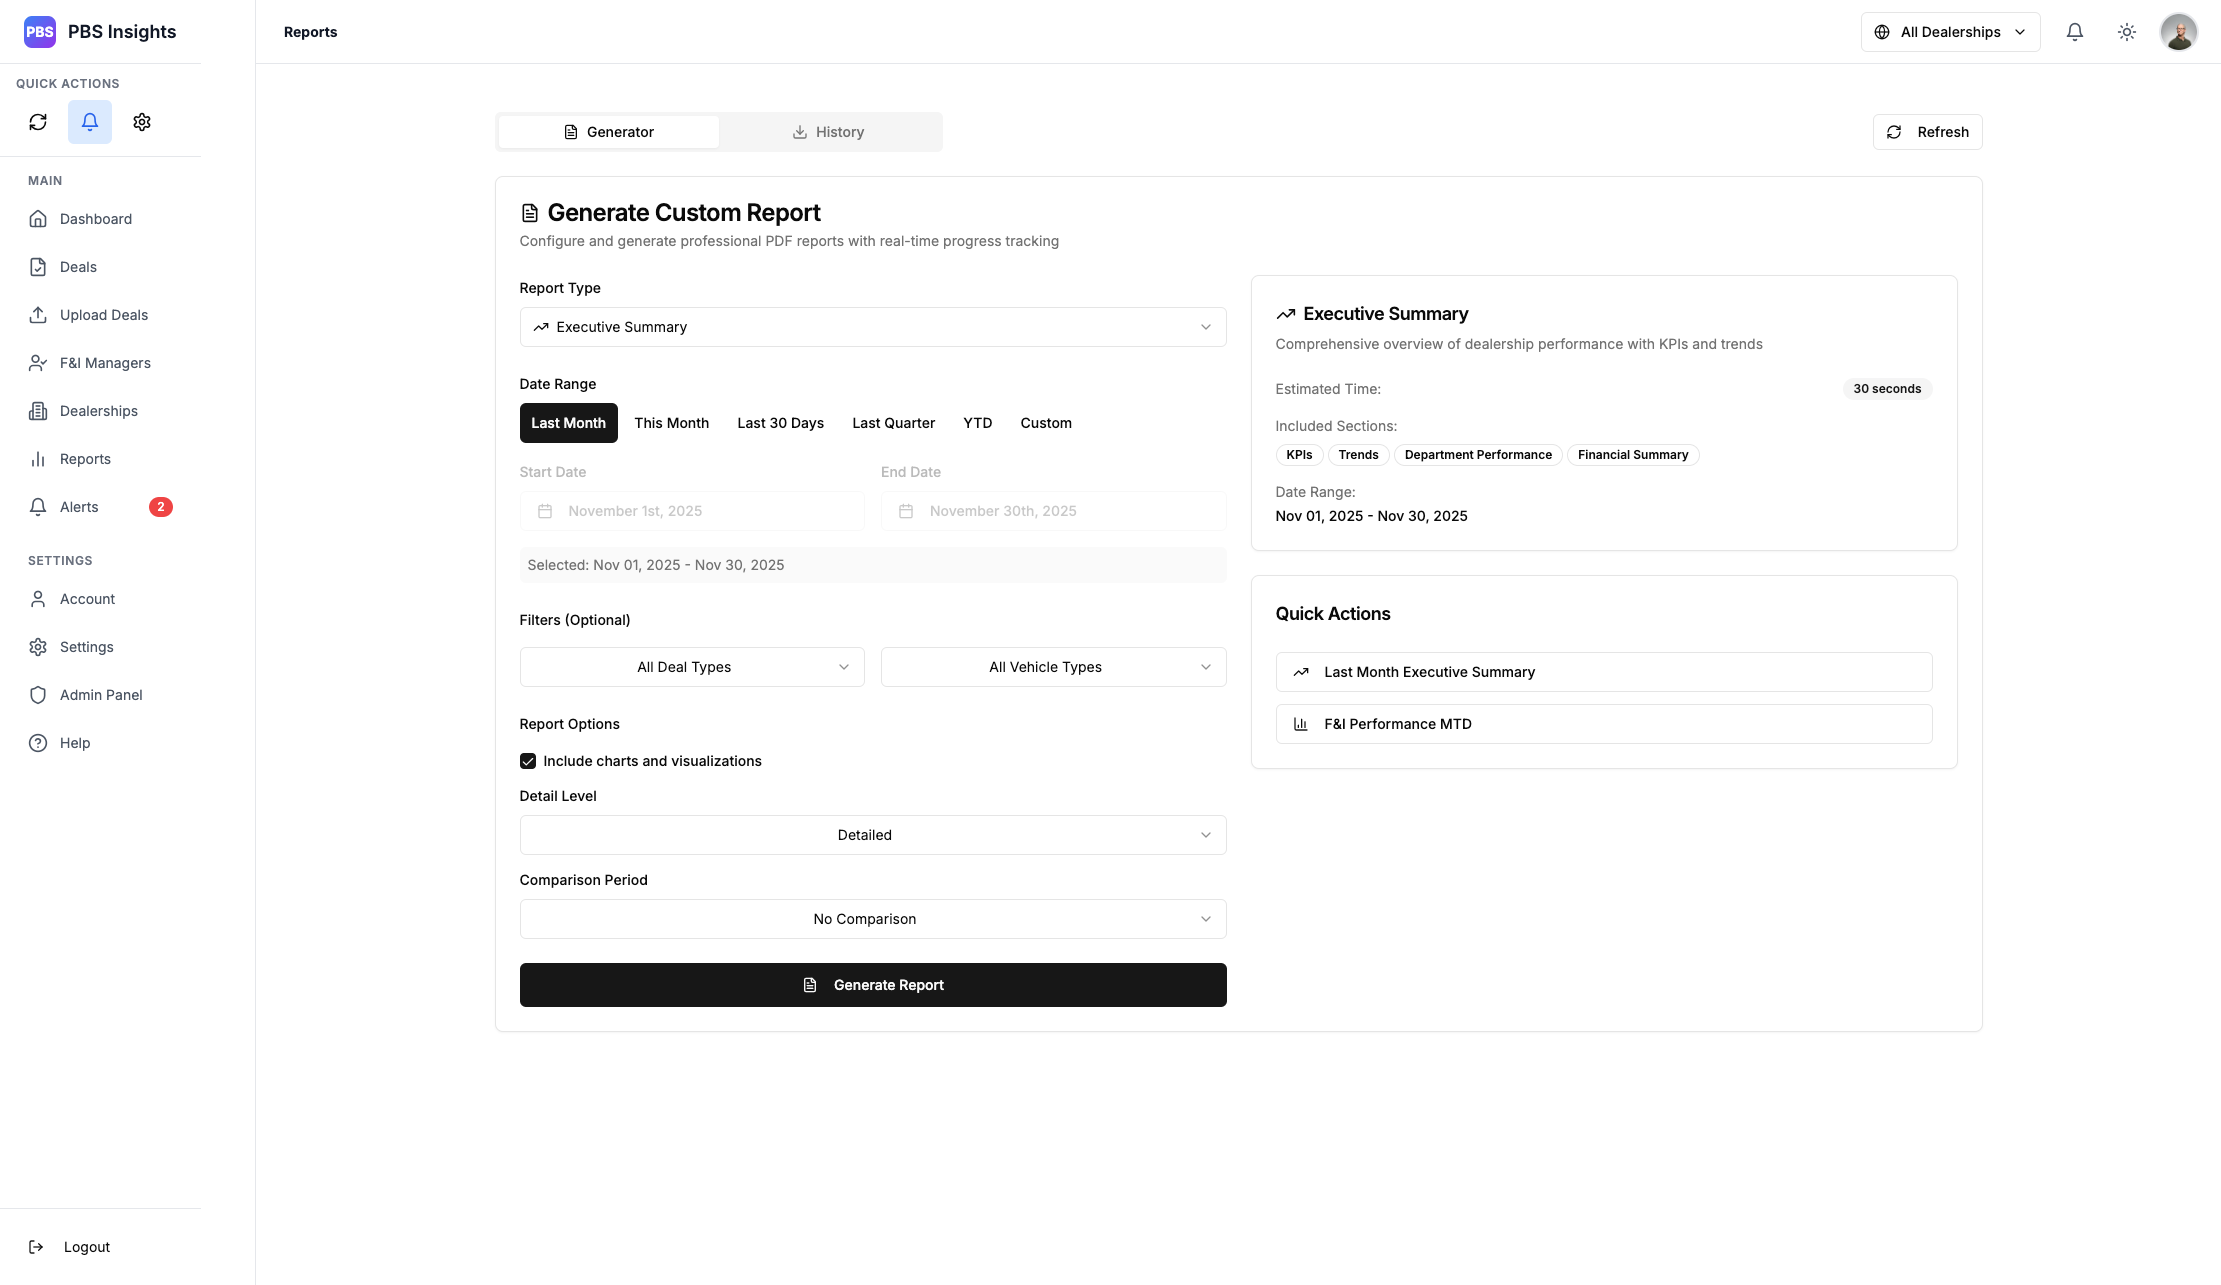
You’re the GSM of the dealership. You’ve been in the industry for a long time, and you wear a lot of hats. Between meetings with shareholders, talks with the owners, and managing your teams - you’ve got a lot on your plate. Your time is valuable, and the last thing you want is to be spending precious hours digging through spreadsheets and sending emails out asking for performance reports.
You have a meeting with the owners in about 30 minutes, and you’ve prepared for it by generating an Executive Summary report in PBS Insights. You’re making coffee while it processes, and you download the PDF after it’s finished.
Report Generation
On your day-to-day, you like to make sure things are running smoothly, so you’ll glance at the Dashboard metrics or check the individual dealer page.
Dealership Management Page
Things are going well, and but you notice that you’re a little low on your GAP and Maintenance packages. You send out a quick text to one of your F&I Directors: “Hey, let’s meet-up after lunch. I want to see us bump those maintenance package numbers.”, generating an F&I report, you send schedule a meeting and attach the PDF as a review point.
These are all things you used to spend hours working on or delegating to your teams, while juggling your day to day activities. You sit down at the meeting desk with your cup of coffee, opening your laptop and projecting your desktop to the meeting screen: the PBS Insights dashboard and the PDF reports you had just generated. You’ve got 10 minutes to spare, so you take that time to type-up a dealer trade with another GSM.
The Structure
This project is built on Next.js 15, React 19, and TypeScript. I went with Next.js and React due to my familiarity with the platforms, and their robust ecosystem.
The project was initially designed to be real-time, but I quietly shifted away from that design decision in favor of a polling system with a Redis layer. By this point, Next was already a staple for the project, so I decided to stay within the framework.
The backend is built on Node.js 18 with Express. I use a Redis 7 layer for sessions, caching, and a Bull queue for my batch processing and job runners.
File processing is done with Multer and passed through an Axios endpoint to retain form data, with the bulk processing done by LlamaIndex for PDFs and GPT 4.1 for images. A system prompt and associated JSON structure are passed to these agents, which asynchronously handle the reading and sanitizing of the data. Returns are passed through a Joi validation schema to sanitize inputs and check for consistency. Reports are generated with Puppeteer and Handlebars.
The API
My backend was built in a RESTful design pattern, following an /api/v1 versioning for future API revisions. All data is stored in a Supabase cluster using PostgreSQL. I went with Supabase for ease of use, and PostgreSQL for security and efficiency.
I utilize connection pooling for performance, and data is isolated and enforced at the table level. Everything is stored under data buckets that I call “Umbrellas”. This is based around a specific dealer code, which associates users to their respective dealerships.
The pattern looks something like this
── Dealer Umbrella
	├── Admins
	├── Executives
	├── Directors
	├── Individual Dealership #1
	│   ├── F&I Managers
	│   ├── Deal Data
	└── Individual Dealership #2
		├── F&I Managers
		├── Deal Data
The idea here is to create a simple hierarchy of “Who needs to see what”.
Admins, Executives, and Directors all need to be able to see the individual dealerships as well as their associated data. However, F&I Managers and individual deals don’t care about other dealerships, and as such they will be associated with their “umbrellas”.
This gives the ability to do relatively granular data pulls and queries. Within the individual dealerships, the separation is done at the query level for speed.
We use Helmet for headers, CORS for origin validation, Joi schemas for input validation, and parameterized queries for SQL Injection prevention.
Background Job Processing
After my first 30+ item import taking 30 seconds processing one item at a time, I immediately said “absolutely not” and began working on a proper batching service.
We follow a dead-letter queue with reporting and retry systems, as well as manual fallbacks.
┌─────────────┐
│ Job Created │
└──────┬──────┘
       │
       ▼
┌─────────────┐
│   Queued    │ ◄─── Waiting for worker availability
└──────┬──────┘
       │
       ▼
┌─────────────┐
│   Active    │ ◄─── Being processed by worker
└──────┬──────┘
       │
       ├─────────────┐
       │             │
       ▼             ▼
┌─────────────┐  ┌─────────────┐
│  Completed  │  │   Failed    │
└─────────────┘  └──────┬──────┘
                        │
                        ├── Retry (if attempts < max)
                        │
                        ▼
                  ┌─────────────┐
                  │ Dead Letter │ ◄─── Max retries exceeded
                  └─────────────┘
It’s simple, but very effective. We use Redis with a Bull queue to handle the worker processing, and can handle up to 30 concurrent jobs at once when processing batch imports (currently limited by the upstream API).
Jobs are automatically cleaned up, logged, and cached. This architecture supports scalable, reliable background processing with real-time updates and error recovery.
The Front-End
I built the front-end to fully utilize the Next.js App Router, and React Query for server state. I use a nested provider structure for my global state, and a NextJS API Proxy to handle my requests.
Everything is built with a user-friendly, visually appealing design pattern. All portions of the app are independent modules that can be worked on individually, preventing a failure in one place from affecting the rest of the app functionality.
I use dynamic imports for heavy components, route-based code splitting, and lazy loading for charts and dashboards. Everything that can be memoized is setup with useMemo and useCallback, with React.memo for component memoization.
Error messages are toasted to the user, and user-friendly.
The intent is a scalable, maintainable frontend with strong type safety and a solid performance.
For those curious, my bundle size is ~1.5mb and ~3mb uncompressed. My Lighthouse performance score is in the high 90s, and I proudly put my user-experience first.
The Deal Import System
This is the bread and butter of the whole application; where our deal information comes in, and where we optimize the workflow of the end-user.
Deal Import Page
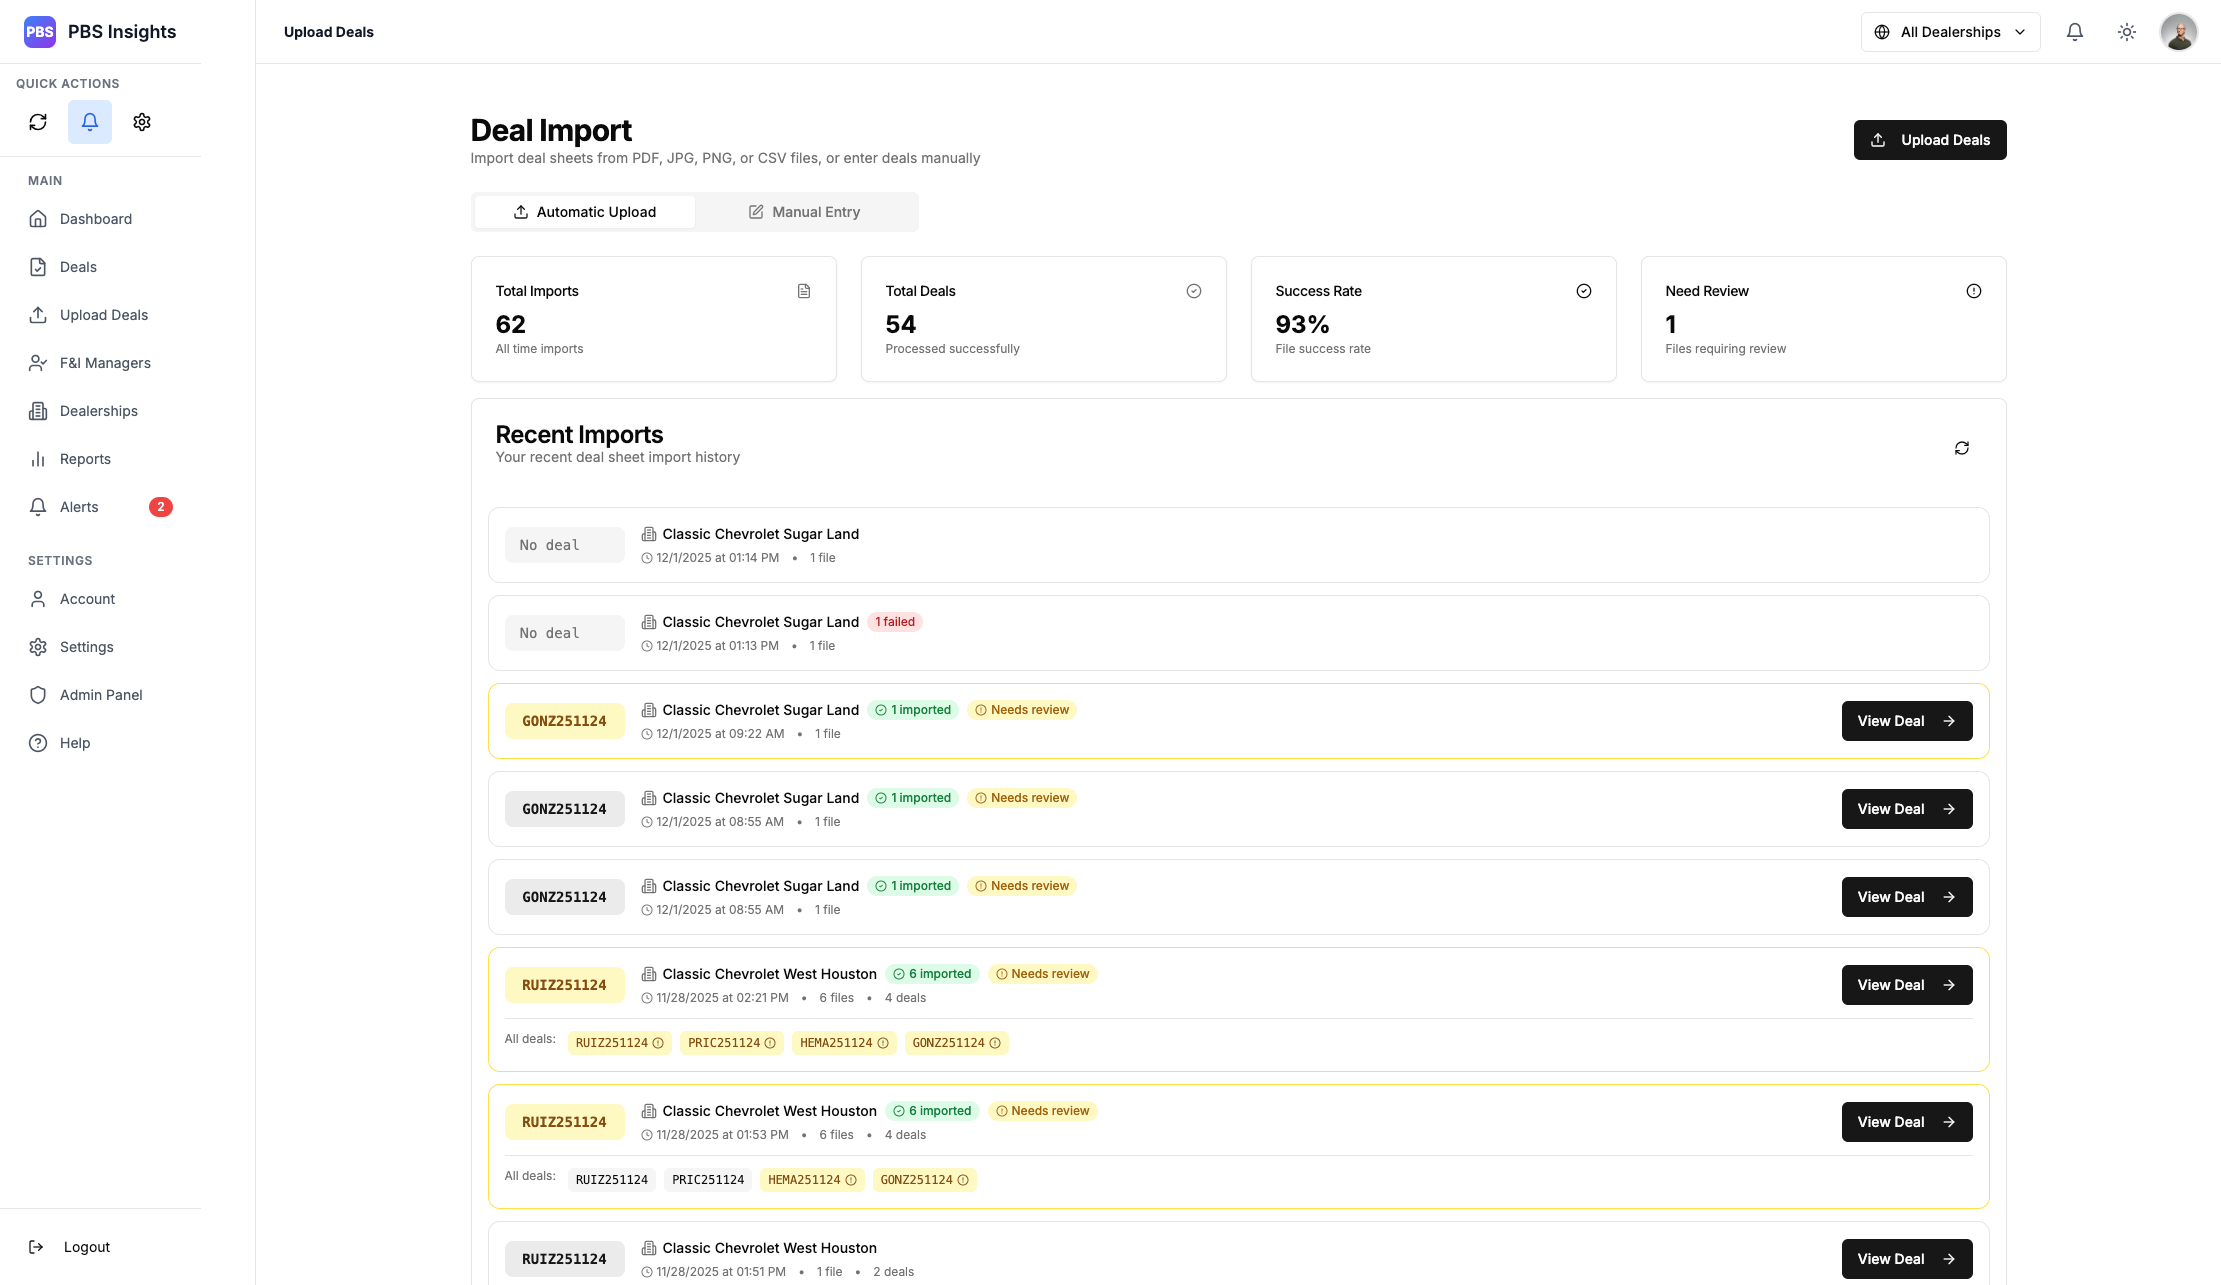
Deals are uploaded via a pop-up modal, and up to 30 concurrent uploads are supported. Images, PDFs, and CSV files are all supported with a smart-ID system that routes the correct files to the correct locations.
Everything is given visual feedback; batch uploads are stored together, review deals are marked, failures and successes are color coded.
Clicking a deal in the recent imports section will take you to that deal, or clicking “View Deal” will achieve the same thing.
Manual Deal Entry
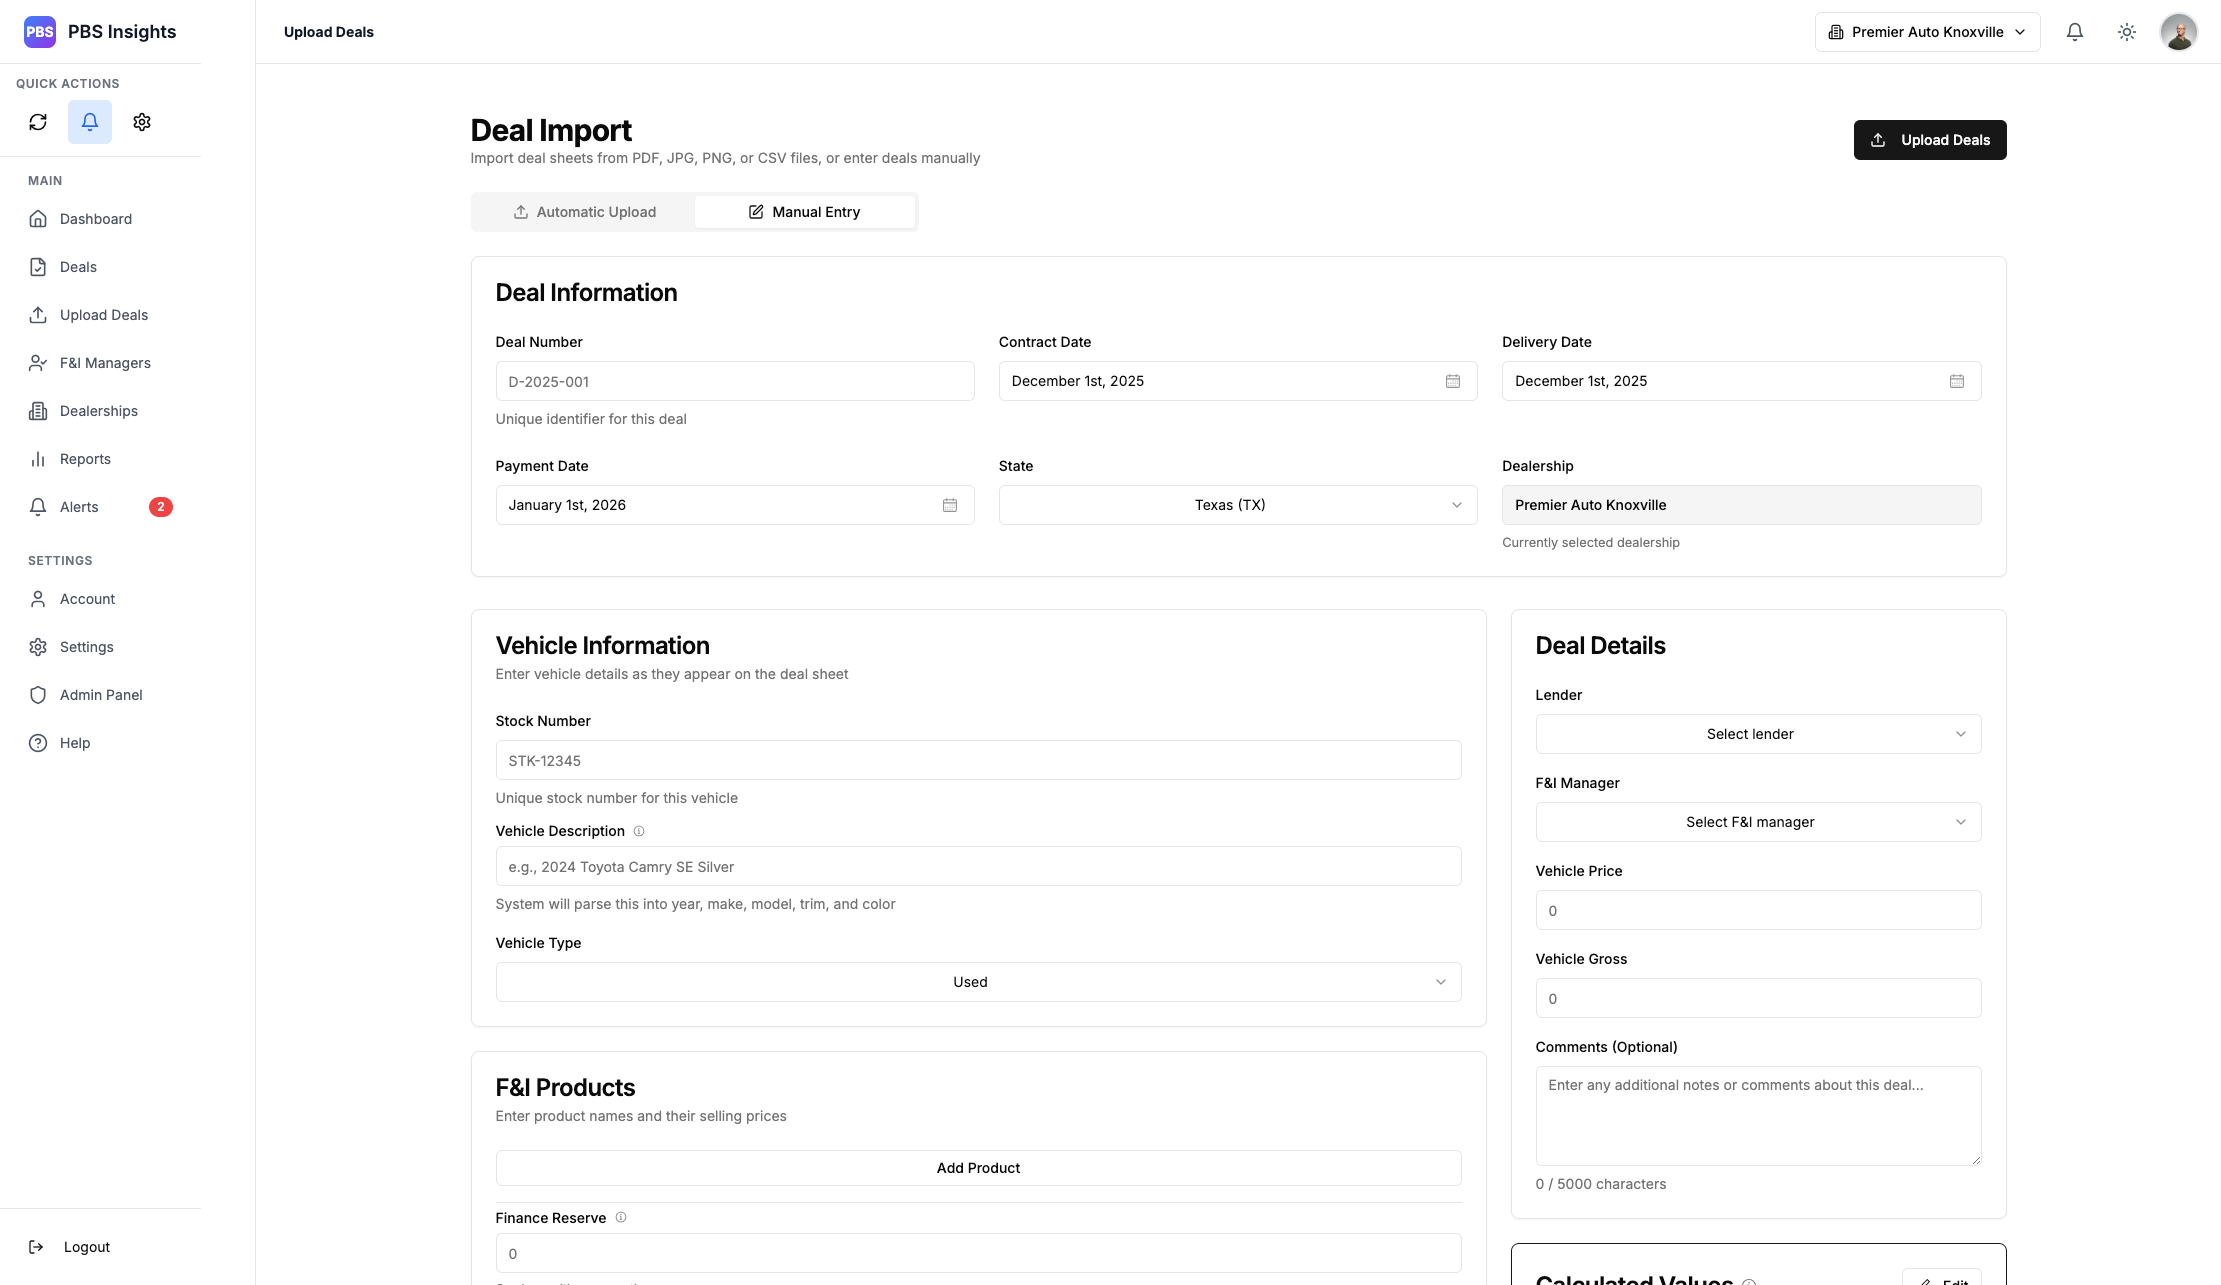
In situations where you cannot upload a deal automatically, we support manual deal inputs. This page tracks all the same deal information the automated system would pull for when processing a deal sheet automatically.
Fields are auto-filled where possible, with support for drop down fields that populate based on existing information within the database - Lenders and F&I Managers will pull from the existing data pool, and the Dealership will default to the one currently selected. Deal values will be calculated automatically based on data input, and the user is prompted to acknowledge that they have reviewed and approved calculated values before submission.
The Deal Grid respects both selected dealership, as well as a global timeframe.
Deal Grid
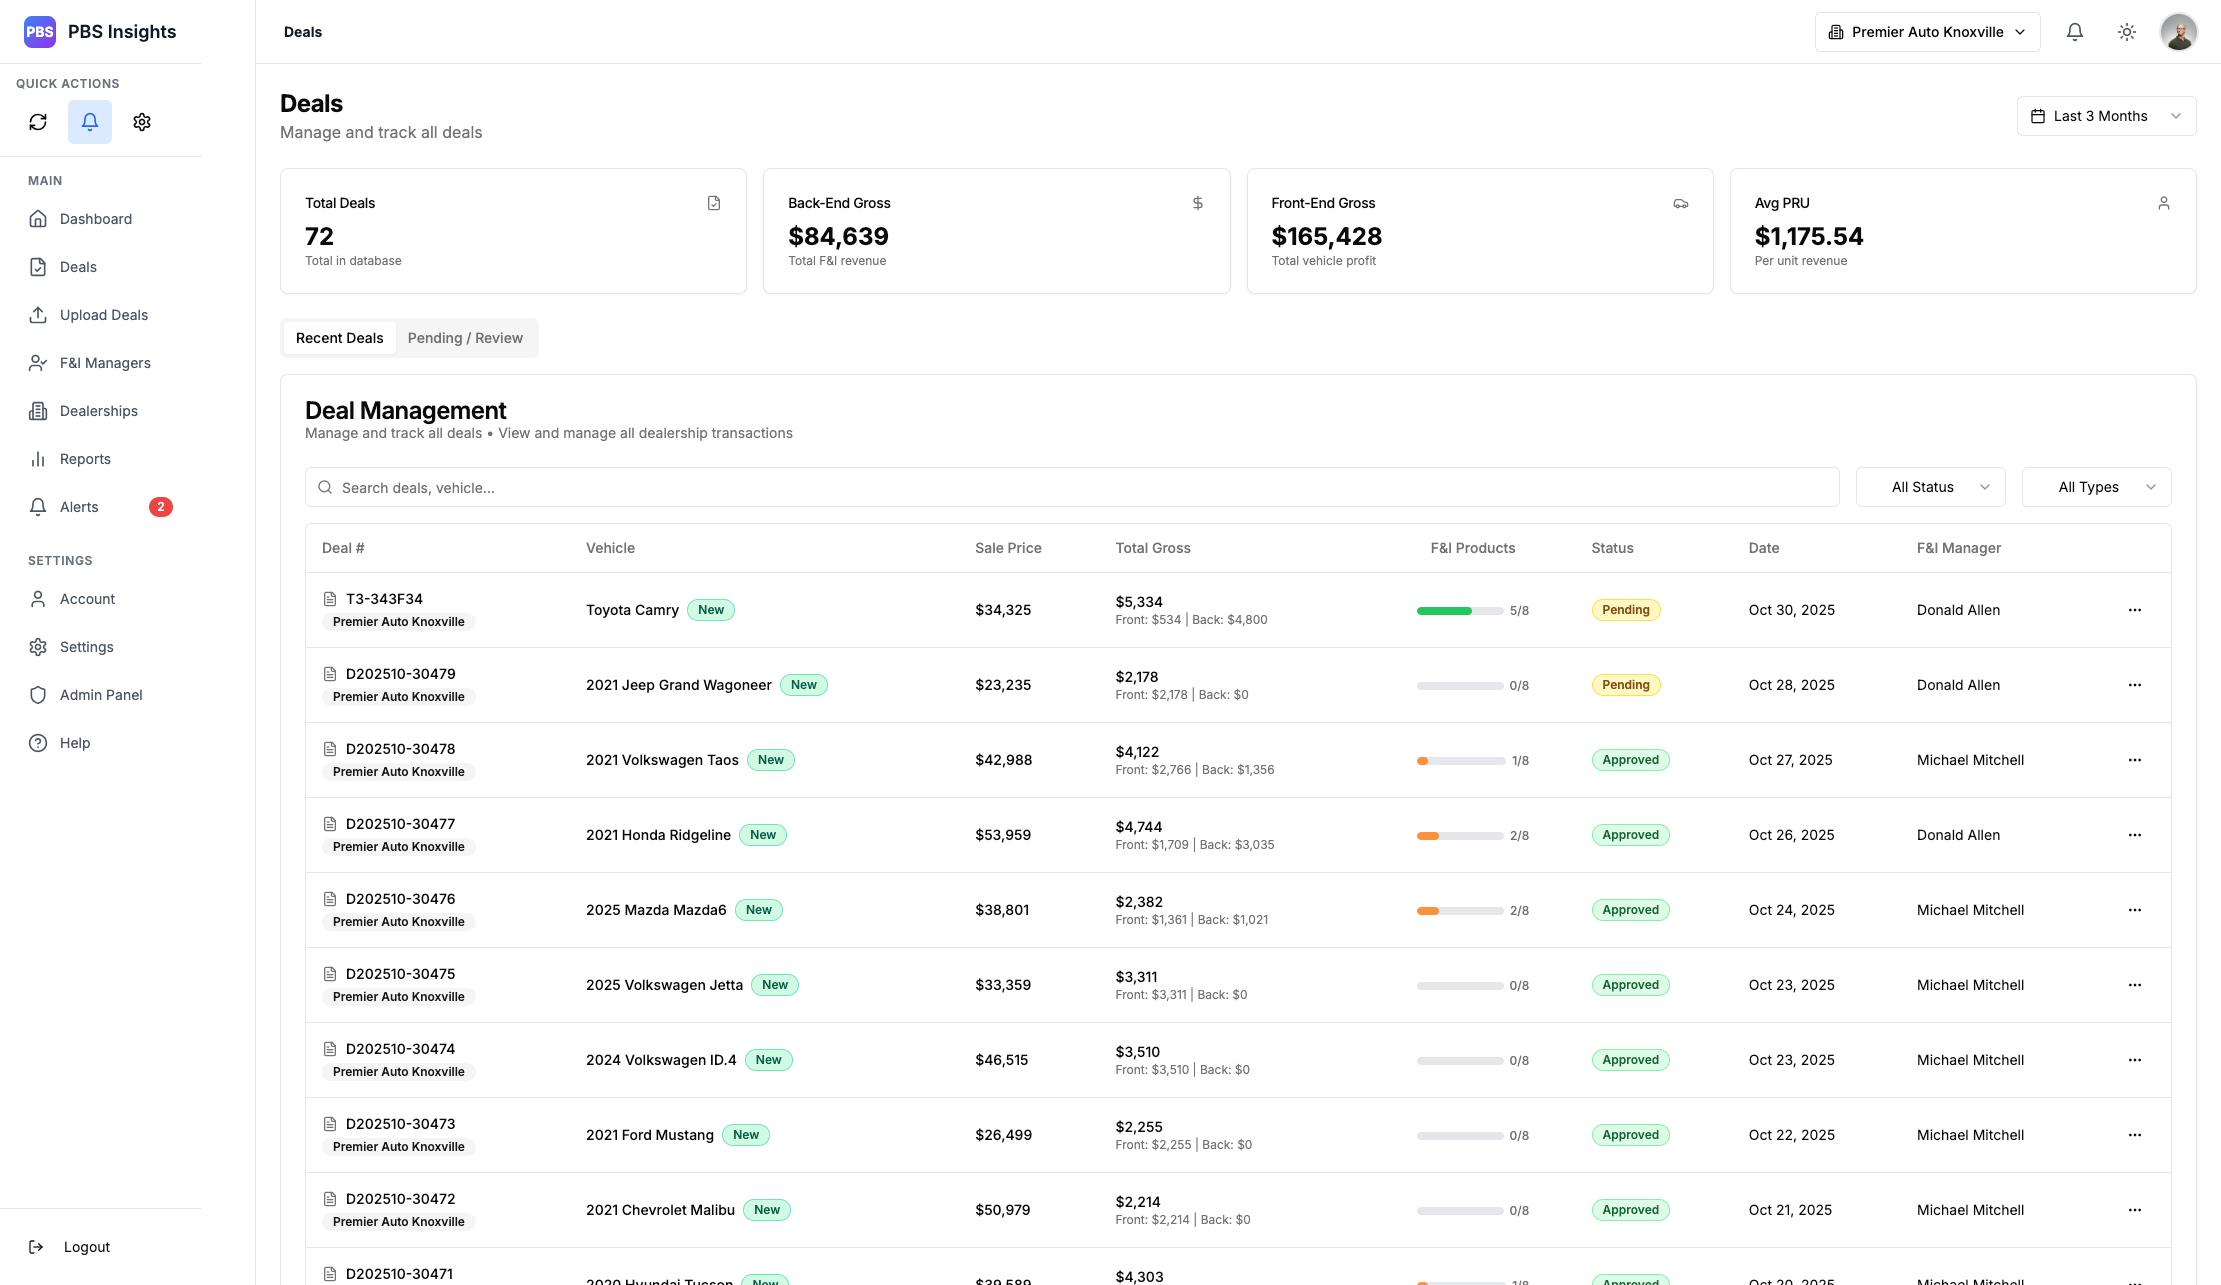
This gives an “at a glance” breakdown of the most recent deals, and their status. The Pending/Review tab will show only deals in Pending/Review status, making them easier to review, following the same user-first design language shown in the rest of the application.
The individual deal pages are clearly labeled with the Dealership, the type of upload, and the person who uploaded them. This follows a color-coding system that shows where gross profit was lost, where it was made, and the overall deal margins.
All deals follow a specific pattern:
── Deal Upload
	├──> Parse Deal
	├──> Confidence Score (0-1)
	├──> Duplicate Check
	├──> Confidence > 0.9
	|   ├──> Deal Status PENDING
	├──> Confidence < 0.9
	|   ├──> Deal Status REVIEW
	└── Deal Saved
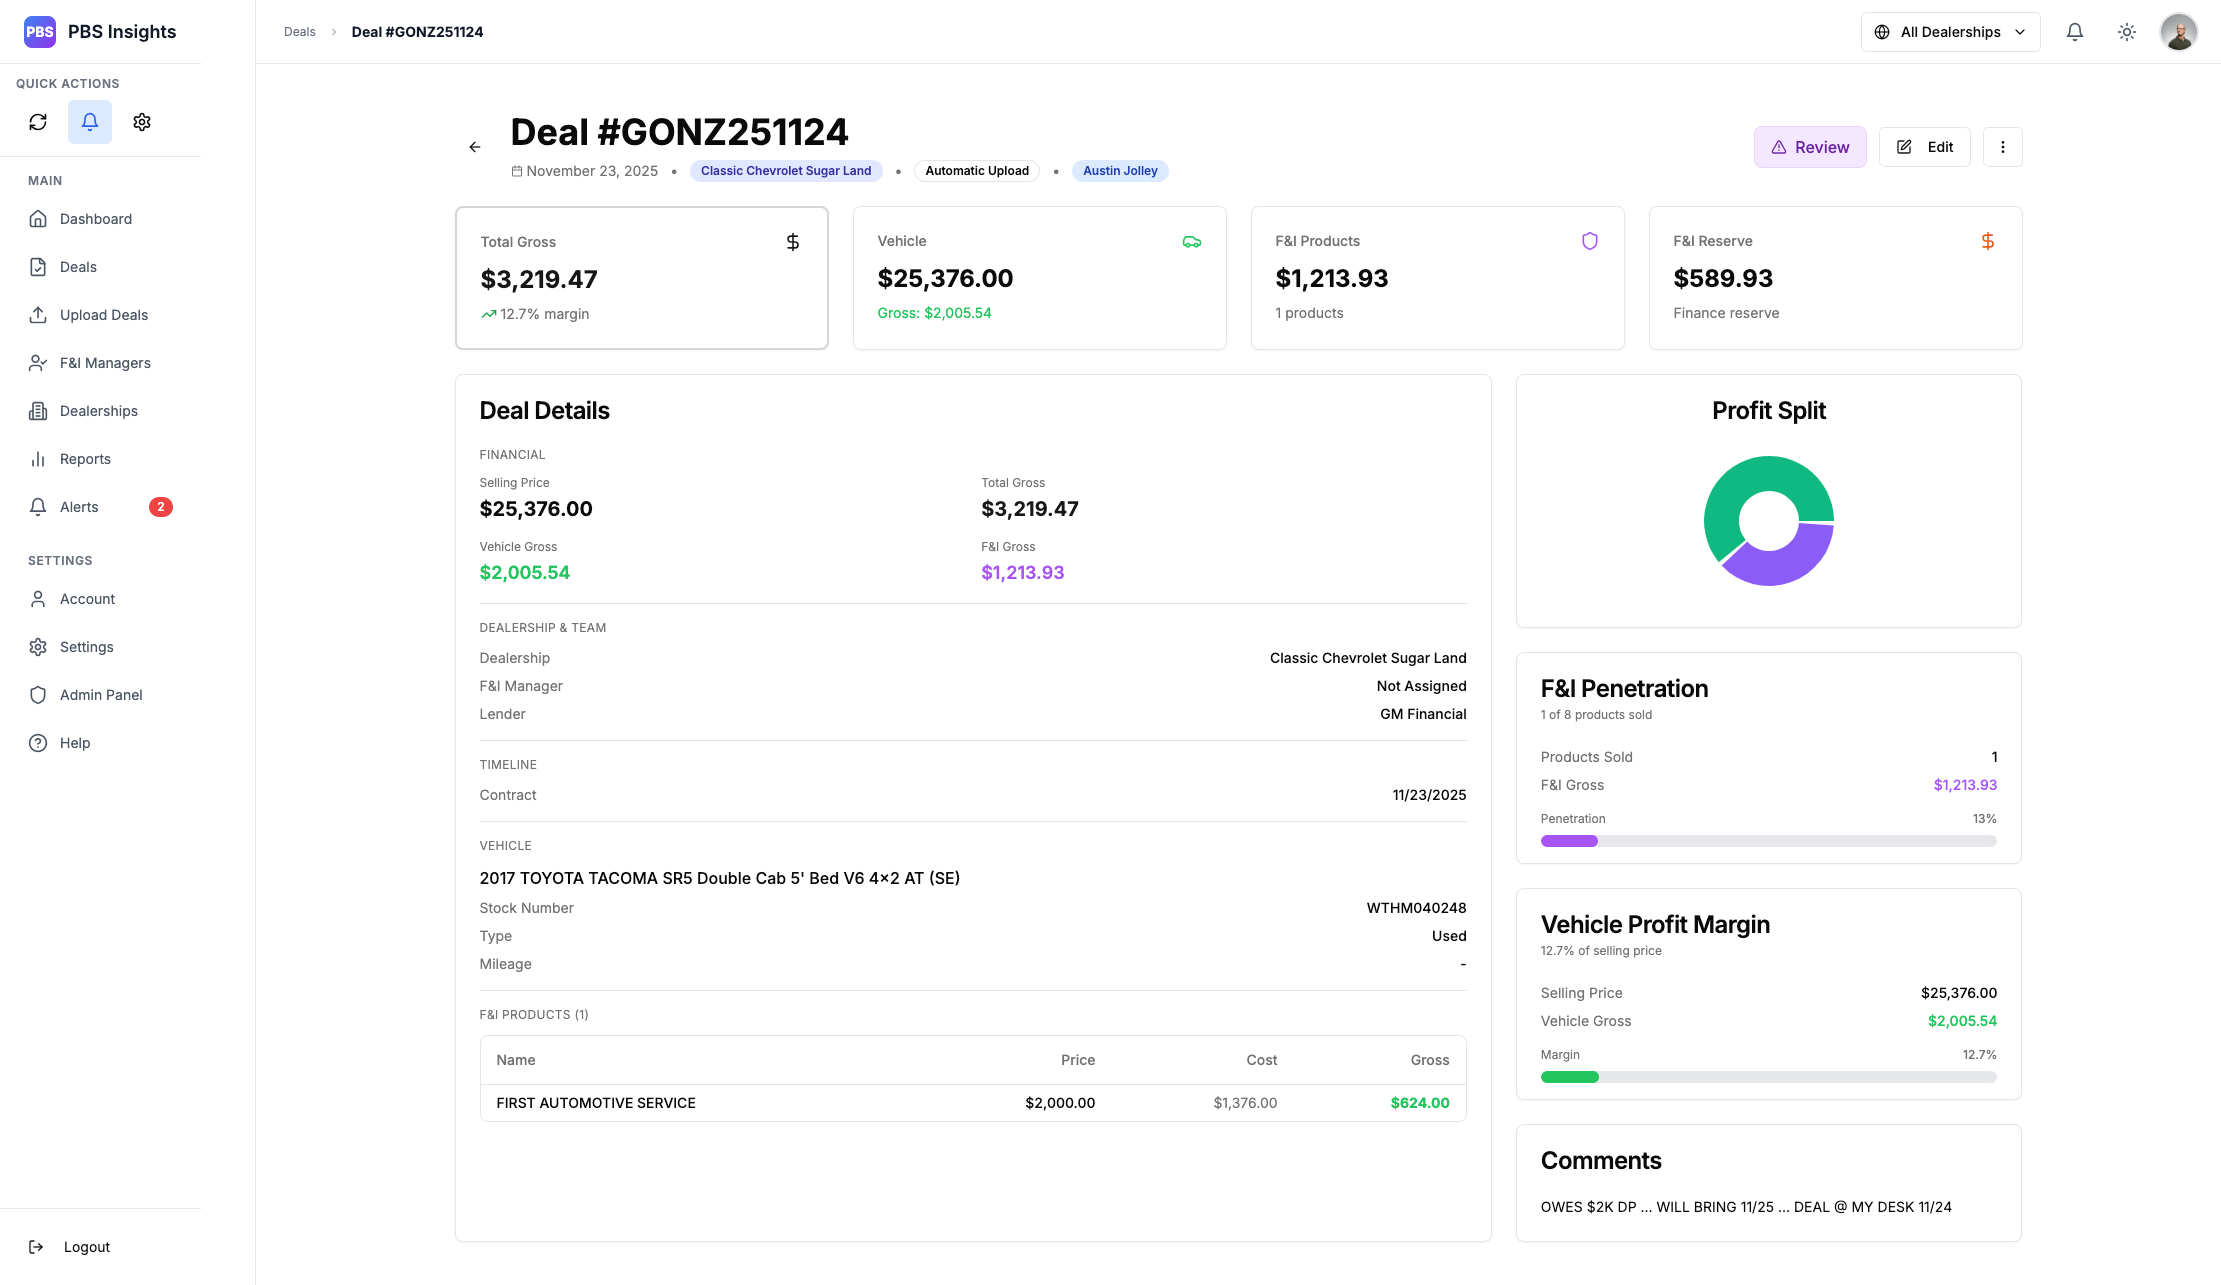
A deal that is in REVIEW status shows up as purple and will require the user to Edit the individual deal page and review each field for accuracy. This is due to the AI being unsure of the data, and adds a layer of validation to avoid hallucination results. After a deal has been reviewed, it will go into PENDING status.
A deal that is in PENDING status shows up as Yellow and can be approved or edited. Pending and Review status deals DO NOT show up in the overall system metrics until they have been put into APPROVED status. This is to prevent potentially incorrect data from poisoning the metrics.
A deal that is in APPROVED status shows up as Green. This information will be pulled as part of the greater metric queries, and is considered “finalized”. If an approved status deal is edited, it will be placed back into PENDING status, requiring re-approval.
Automatically Uploaded Deal in Review Status
I also built out an entire in-line editing system that makes it incredibly easy to modify data.
Deal Edit Page
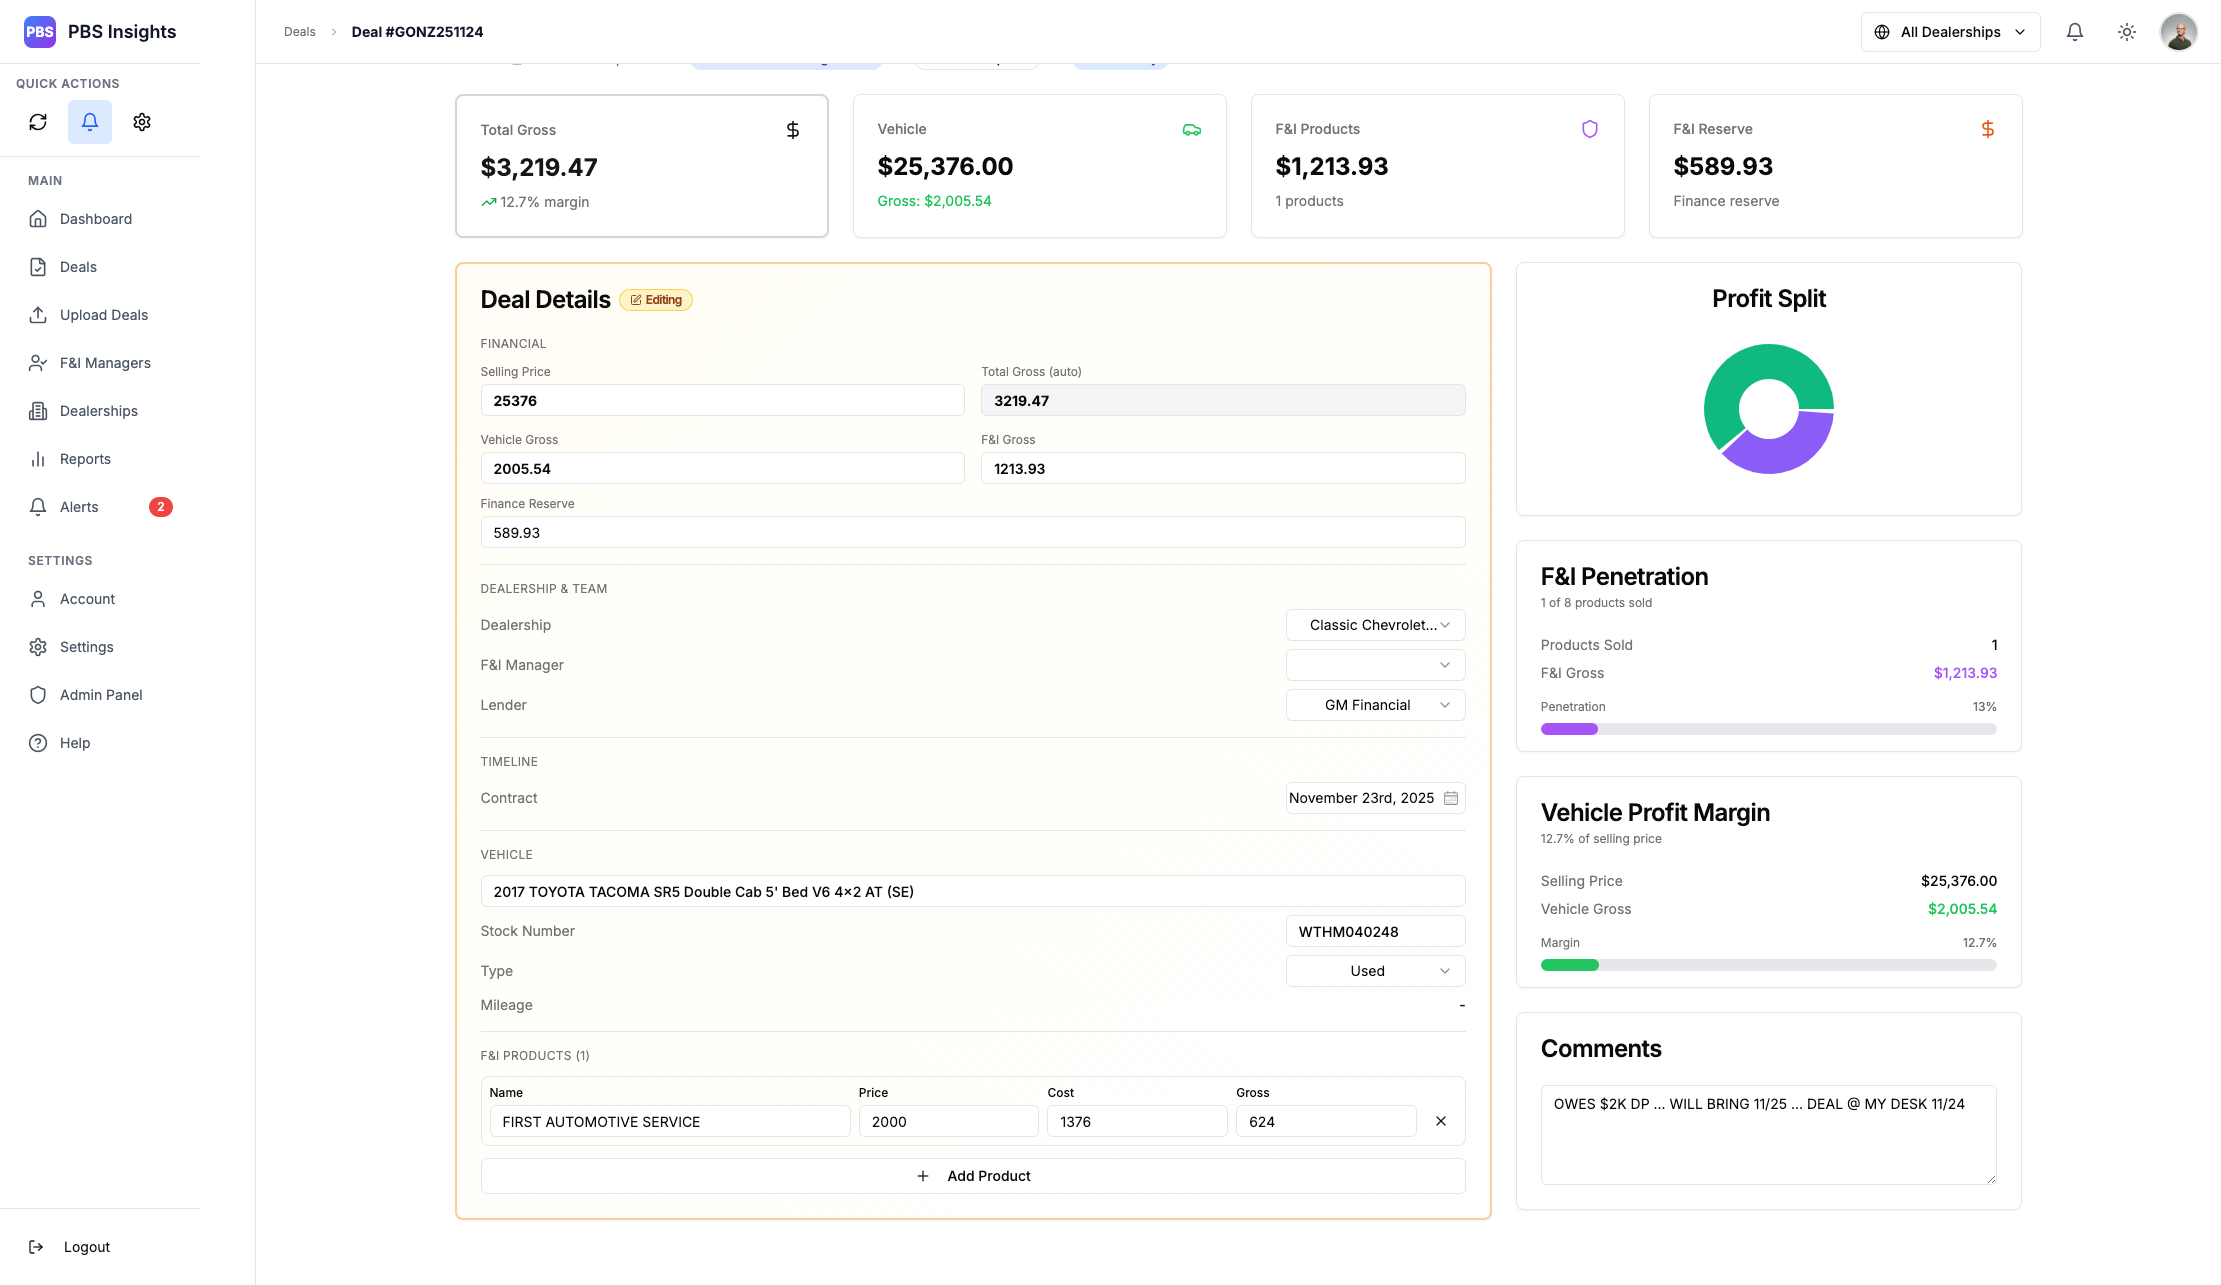
All data here will be automatically calculated and validated upon submission, preventing potential errors with calculations like F&I Gross against the product and reserve numbers.
The front-end as a whole was built with the intent of making the easer experience as clean as possible. Visual markers and consistent coloring gives it that “at a glance” theme, while staying within the same design language that makes up the greater product.
The Final Project
PBS Insights is currently in production and being piloted by a handful of dealerships. The app is still in a development state, as such bugs are expected and being actively squashed.
I’ll be maintaining this document as development continues, so look out for a “Final Project” section update in the coming months!